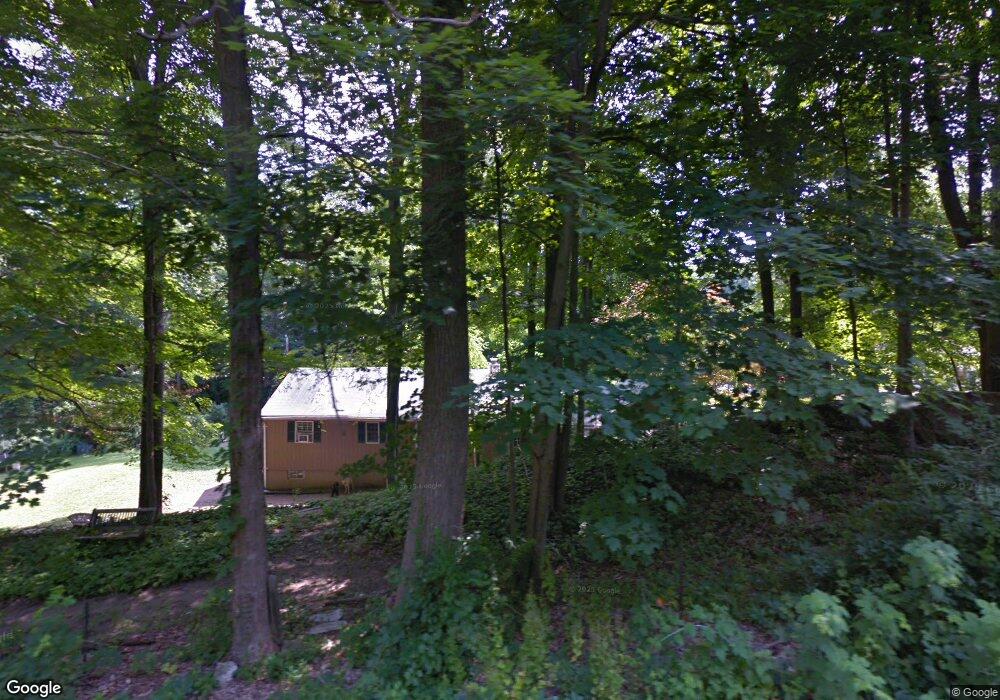
39 Woodland Way Ridgefield, CT 06877
Estimated Value: $510,686 - $558,000
2
Beds
1
Bath
1,142
Sq Ft
$465/Sq Ft
Est. Value
About This Home
This home is located at 39 Woodland Way, Ridgefield, CT 06877 and is currently estimated at $530,922, approximately $464 per square foot. 39 Woodland Way is a home located in Fairfield County with nearby schools including Ridgebury Elementary School, Scotts Ridge Middle School, and Ridgefield High School.
Ownership History
Date
Name
Owned For
Owner Type
Purchase Details
Closed on
Jun 4, 2025
Sold by
Whalen Catherine
Bought by
Whalen Catherine
Current Estimated Value
Purchase Details
Closed on
Aug 22, 2000
Sold by
Hayden Robert A
Bought by
Bonner John D
Home Financials for this Owner
Home Financials are based on the most recent Mortgage that was taken out on this home.
Original Mortgage
$215,700
Interest Rate
8.13%
Mortgage Type
Purchase Money Mortgage
Purchase Details
Closed on
May 10, 1999
Sold by
Titus Jeffrey A and Titus Christine M
Bought by
Hayden Robert A
Purchase Details
Closed on
Oct 1, 1997
Sold by
Wright Elmer G and Wright Karen B
Bought by
Titus Jeffrey A and Titus Christine M
Create a Home Valuation Report for This Property
The Home Valuation Report is an in-depth analysis detailing your home's value as well as a comparison with similar homes in the area
Home Values in the Area
Average Home Value in this Area
Purchase History
| Date | Buyer | Sale Price | Title Company |
|---|---|---|---|
| Whalen Catherine | -- | -- | |
| Bonner John D | $270,000 | -- | |
| Bonner John D | $270,000 | -- | |
| Hayden Robert A | $256,000 | -- | |
| Hayden Robert A | $256,000 | -- | |
| Titus Jeffrey A | $202,500 | -- | |
| Titus Jeffrey A | $202,500 | -- |
Source: Public Records
Mortgage History
| Date | Status | Borrower | Loan Amount |
|---|---|---|---|
| Previous Owner | Titus Jeffrey A | $218,500 | |
| Previous Owner | Titus Jeffrey A | $215,700 |
Source: Public Records
Tax History Compared to Growth
Tax History
| Year | Tax Paid | Tax Assessment Tax Assessment Total Assessment is a certain percentage of the fair market value that is determined by local assessors to be the total taxable value of land and additions on the property. | Land | Improvement |
|---|---|---|---|---|
| 2025 | $6,829 | $249,340 | $138,600 | $110,740 |
| 2024 | $6,570 | $249,340 | $138,600 | $110,740 |
| 2023 | $6,435 | $249,340 | $138,600 | $110,740 |
| 2022 | $6,547 | $230,300 | $115,500 | $114,800 |
| 2021 | $6,497 | $230,300 | $115,500 | $114,800 |
| 2020 | $6,476 | $230,300 | $115,500 | $114,800 |
| 2019 | $6,476 | $230,300 | $115,500 | $114,800 |
| 2018 | $6,398 | $230,300 | $115,500 | $114,800 |
| 2017 | $5,756 | $211,530 | $93,500 | $118,030 |
| 2016 | $5,646 | $211,530 | $93,500 | $118,030 |
| 2015 | $5,502 | $211,530 | $93,500 | $118,030 |
| 2014 | $5,502 | $211,530 | $93,500 | $118,030 |
Source: Public Records
Map
Nearby Homes
- 381 Bennetts Farm Rd
- 8 Rustic Rd
- 109 Mountain Rd
- 34 Highview Dr
- 83 Aspen Ledges Rd
- 0 Ives Ct
- 76 Sugarloaf Mountain Rd
- 463 N Salem Rd
- 56 E Starrs Plain Rd
- 4 Alan Rd
- 358 N Salem Rd
- 23 Pond Rd
- 81 Picketts Ridge Rd
- 21 Olympic Dr
- 27 Carol St
- 15 Marc Rd
- 29 Carol St
- 176 Picketts Ridge Rd
- 261 North St
- 8 Cornerstone Ct
- 36 Woodland Way
- 37 Woodland Way
- 35 Woodland Way
- 40 Woodland Way
- 32 Woodland Way
- 398 Bennetts Farm Rd
- 400 Bennetts Farm Rd
- 5 Sylvan Dr
- 411 Bennetts Farm Rd
- 29 Woodland Way
- 30 Woodland Way
- 1 Sylvan Dr
- 389 Bennetts Farm Rd
- 414 Bennetts Farm Rd
- 394 Bennetts Farm Rd
- 27 Woodland Way
- 26 Midrocks Rd
- 5 Ridgeway Terrace
- 24 Midrocks Rd
- 53 Lakeside Dr