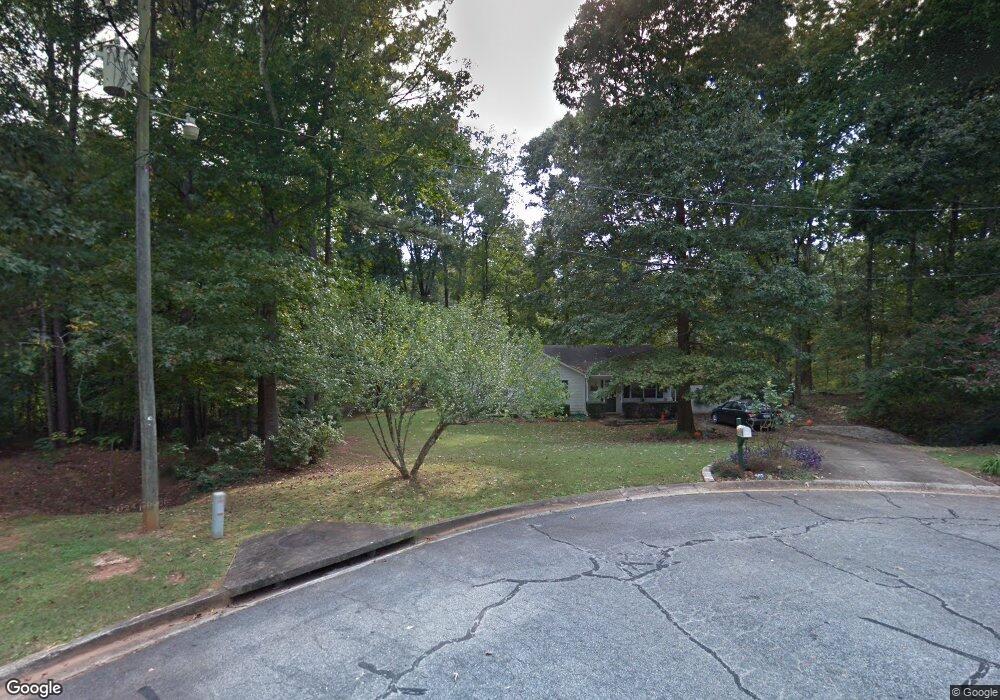
39 Yeager Ct Newnan, GA 30265
Estimated Value: $235,000 - $286,000
3
Beds
2
Baths
1,152
Sq Ft
$219/Sq Ft
Est. Value
About This Home
This home is located at 39 Yeager Ct, Newnan, GA 30265 and is currently estimated at $252,354, approximately $219 per square foot. 39 Yeager Ct is a home located in Coweta County with nearby schools including Welch Elementary School, East Coweta Middle School, and East Coweta High School.
Ownership History
Date
Name
Owned For
Owner Type
Purchase Details
Closed on
Jul 2, 2004
Sold by
Field Rannie L and Field Tonya L
Bought by
Harris Susan J
Current Estimated Value
Home Financials for this Owner
Home Financials are based on the most recent Mortgage that was taken out on this home.
Original Mortgage
$89,920
Outstanding Balance
$45,011
Interest Rate
6.25%
Mortgage Type
New Conventional
Estimated Equity
$207,343
Purchase Details
Closed on
Mar 17, 1993
Sold by
Brack Homes
Bought by
Field Ronnie L and Field Tonya L
Home Financials for this Owner
Home Financials are based on the most recent Mortgage that was taken out on this home.
Original Mortgage
$57,170
Interest Rate
7.8%
Mortgage Type
FHA
Purchase Details
Closed on
Sep 22, 1992
Bought by
Brack Marvin
Purchase Details
Closed on
Jun 8, 1990
Bought by
Orr Howard
Purchase Details
Closed on
Aug 25, 1989
Bought by
Rice Freddie and Rice Howar
Create a Home Valuation Report for This Property
The Home Valuation Report is an in-depth analysis detailing your home's value as well as a comparison with similar homes in the area
Home Values in the Area
Average Home Value in this Area
Purchase History
| Date | Buyer | Sale Price | Title Company |
|---|---|---|---|
| Harris Susan J | $111,900 | -- | |
| Field Ronnie L | $57,900 | -- | |
| Brack Marvin | $13,900 | -- | |
| Brack Homes Inc | $10,000 | -- | |
| Orr Howard | -- | -- | |
| Rice Freddie | $46,800 | -- |
Source: Public Records
Mortgage History
| Date | Status | Borrower | Loan Amount |
|---|---|---|---|
| Open | Harris Susan J | $89,920 | |
| Previous Owner | Field Ronnie L | $57,170 |
Source: Public Records
Tax History Compared to Growth
Tax History
| Year | Tax Paid | Tax Assessment Tax Assessment Total Assessment is a certain percentage of the fair market value that is determined by local assessors to be the total taxable value of land and additions on the property. | Land | Improvement |
|---|---|---|---|---|
| 2024 | $377 | $58,049 | $16,000 | $42,049 |
| 2023 | $377 | $50,287 | $16,000 | $34,287 |
| 2022 | $340 | $49,058 | $16,000 | $33,058 |
| 2021 | $317 | $44,207 | $16,000 | $28,207 |
| 2020 | $277 | $46,956 | $16,000 | $30,956 |
| 2019 | $184 | $26,961 | $10,000 | $16,961 |
| 2018 | $186 | $26,961 | $10,000 | $16,961 |
| 2017 | $152 | $23,756 | $8,000 | $15,756 |
| 2016 | $147 | $23,756 | $8,000 | $15,756 |
| 2015 | $139 | $23,756 | $8,000 | $15,756 |
| 2014 | $543 | $23,756 | $8,000 | $15,756 |
Source: Public Records
Map
Nearby Homes