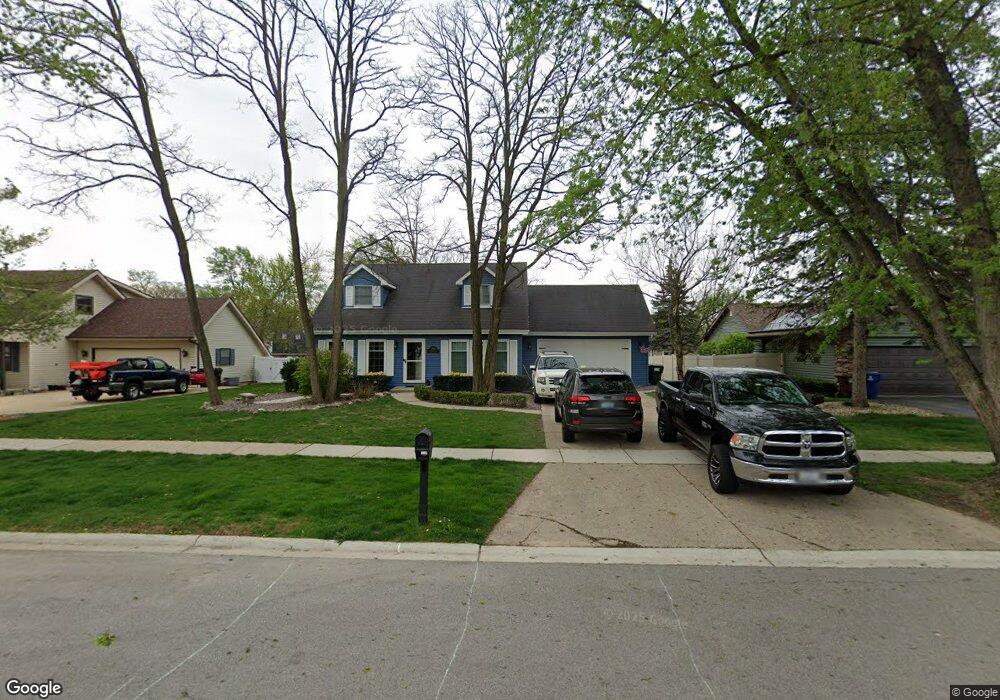
390 Aspen Dr New Lenox, IL 60451
Estimated Value: $388,000 - $428,000
--
Bed
--
Bath
--
Sq Ft
10,019
Sq Ft Lot
About This Home
This home is located at 390 Aspen Dr, New Lenox, IL 60451 and is currently estimated at $409,427. 390 Aspen Dr is a home located in Will County with nearby schools including Oster-Oakview School, Haines Elementary School, and Lincoln Way West.
Ownership History
Date
Name
Owned For
Owner Type
Purchase Details
Closed on
Oct 10, 2013
Sold by
Katcher Michael S and Katcher Renee S
Bought by
Green James E and Green Sabrina R
Current Estimated Value
Home Financials for this Owner
Home Financials are based on the most recent Mortgage that was taken out on this home.
Original Mortgage
$190,272
Outstanding Balance
$141,575
Interest Rate
4.25%
Mortgage Type
FHA
Estimated Equity
$267,852
Purchase Details
Closed on
Apr 22, 1998
Sold by
Potts Judith L
Bought by
Katcher Michael S and Katcher Renee S
Home Financials for this Owner
Home Financials are based on the most recent Mortgage that was taken out on this home.
Original Mortgage
$77,000
Interest Rate
7.26%
Purchase Details
Closed on
Feb 8, 1996
Sold by
Potts Kenneth R
Bought by
Potts Judith L
Purchase Details
Closed on
Oct 25, 1990
Bought by
Katcher Michael
Create a Home Valuation Report for This Property
The Home Valuation Report is an in-depth analysis detailing your home's value as well as a comparison with similar homes in the area
Home Values in the Area
Average Home Value in this Area
Purchase History
| Date | Buyer | Sale Price | Title Company |
|---|---|---|---|
| Green James E | $220,000 | Fidelity National Title | |
| Katcher Michael S | $177,000 | Intercounty Title | |
| Potts Judith L | -- | -- | |
| Katcher Michael | $157,000 | -- |
Source: Public Records
Mortgage History
| Date | Status | Borrower | Loan Amount |
|---|---|---|---|
| Open | Green James E | $190,272 | |
| Previous Owner | Katcher Michael S | $77,000 |
Source: Public Records
Tax History Compared to Growth
Tax History
| Year | Tax Paid | Tax Assessment Tax Assessment Total Assessment is a certain percentage of the fair market value that is determined by local assessors to be the total taxable value of land and additions on the property. | Land | Improvement |
|---|---|---|---|---|
| 2024 | $9,921 | $130,253 | $36,367 | $93,886 |
| 2023 | $9,921 | $118,735 | $33,151 | $85,584 |
| 2022 | $8,945 | $109,383 | $30,540 | $78,843 |
| 2021 | $8,490 | $102,871 | $28,722 | $74,149 |
| 2020 | $8,247 | $99,200 | $27,697 | $71,503 |
| 2019 | $7,892 | $96,124 | $26,838 | $69,286 |
| 2018 | $7,709 | $92,811 | $25,913 | $66,898 |
| 2017 | $7,324 | $90,143 | $25,168 | $64,975 |
| 2016 | $7,108 | $87,730 | $24,494 | $63,236 |
| 2015 | $6,846 | $84,969 | $23,723 | $61,246 |
| 2014 | $6,846 | $83,920 | $23,430 | $60,490 |
| 2013 | $6,846 | $85,051 | $23,746 | $61,305 |
Source: Public Records
Map
Nearby Homes
- 217 Aspen Dr
- 1231 Town Crest Dr Unit E
- 224 Hauser Ct
- 200 Redwood Ave
- 208 Redwood Ave
- 1344 N Cedar Rd
- 133 Barbara Ln
- 203 Fir St
- 125 Kimber Dr
- 807 Picardy Place
- 1261 S Regan Rd
- 338 Willow St
- 331 Old Hickory Rd
- 202 Hickory St
- 328 E Lincoln Hwy
- 416 Manor Ct Unit B
- 315 S Pine St
- 1125 Georgias Way
- Vacant W Maple St
- 117 Walona Ave