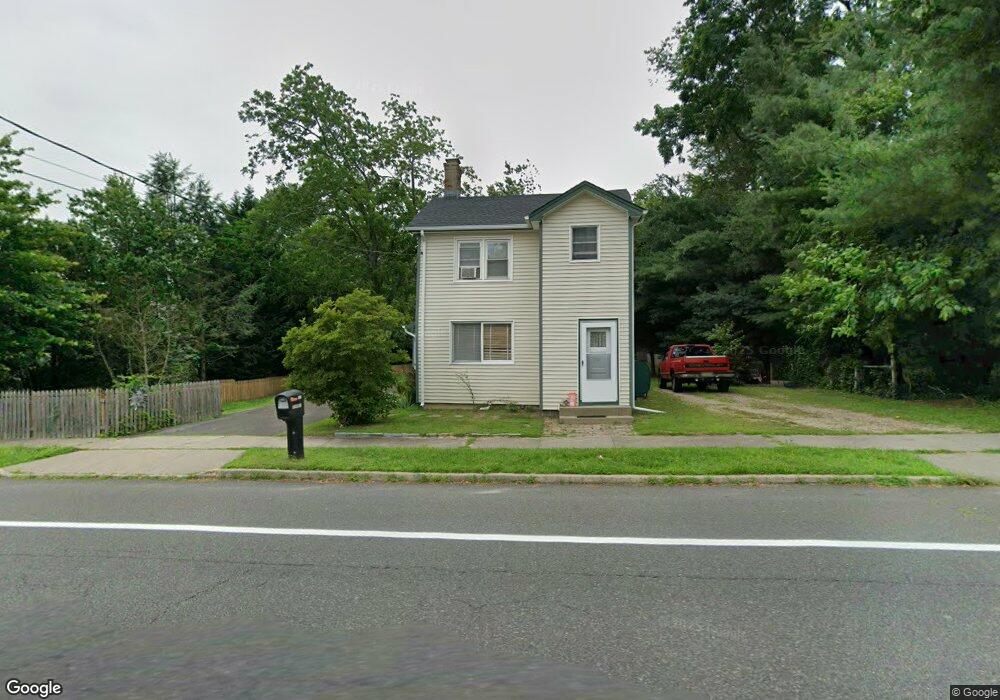
390 Bartley Rd Jackson, NJ 08527
Estimated Value: $539,000 - $619,000
2
Beds
1
Bath
1,717
Sq Ft
$332/Sq Ft
Est. Value
About This Home
This home is located at 390 Bartley Rd, Jackson, NJ 08527 and is currently estimated at $570,039, approximately $331 per square foot. 390 Bartley Rd is a home located in Ocean County with nearby schools including Howard C. Johnson Elementary School, Carl W. Goetz Middle School, and Jackson Memorial High School.
Ownership History
Date
Name
Owned For
Owner Type
Purchase Details
Closed on
Dec 12, 2011
Sold by
Briggs Harold E and Briggs Joyce C
Bought by
Behaney Christopher
Current Estimated Value
Home Financials for this Owner
Home Financials are based on the most recent Mortgage that was taken out on this home.
Original Mortgage
$161,791
Outstanding Balance
$113,245
Interest Rate
4.5%
Mortgage Type
FHA
Estimated Equity
$456,794
Create a Home Valuation Report for This Property
The Home Valuation Report is an in-depth analysis detailing your home's value as well as a comparison with similar homes in the area
Home Values in the Area
Average Home Value in this Area
Purchase History
| Date | Buyer | Sale Price | Title Company |
|---|---|---|---|
| Behaney Christopher | $166,000 | Multiple |
Source: Public Records
Mortgage History
| Date | Status | Borrower | Loan Amount |
|---|---|---|---|
| Open | Behaney Christopher | $161,791 |
Source: Public Records
Tax History
| Year | Tax Paid | Tax Assessment Tax Assessment Total Assessment is a certain percentage of the fair market value that is determined by local assessors to be the total taxable value of land and additions on the property. | Land | Improvement |
|---|---|---|---|---|
| 2025 | $6,420 | $513,000 | $195,400 | $317,600 |
| 2024 | $6,200 | $241,900 | $101,100 | $140,800 |
| 2023 | $6,074 | $241,900 | $101,100 | $140,800 |
| 2022 | $6,074 | $241,900 | $101,100 | $140,800 |
| 2021 | $5,614 | $241,900 | $101,100 | $140,800 |
| 2020 | $5,912 | $241,900 | $101,100 | $140,800 |
| 2019 | $5,832 | $241,900 | $101,100 | $140,800 |
| 2018 | $5,692 | $241,900 | $101,100 | $140,800 |
| 2017 | $5,205 | $226,700 | $101,100 | $125,600 |
| 2016 | $5,128 | $226,700 | $101,100 | $125,600 |
| 2015 | $5,040 | $226,700 | $101,100 | $125,600 |
| 2014 | $4,908 | $226,700 | $101,100 | $125,600 |
Source: Public Records
Map
Nearby Homes
- 24 Sunny Woods Ln
- 433 Meadowood Rd
- 7 Alan Terrace
- 129 Andover Rd
- 3 Macintosh Ct
- 15 E Scarlet Oak Ct
- 4 Salem Ln
- 63 N New Prospect Rd
- 53 N New Prospect Rd
- 3 Knightsbridge Place
- 26 Chiswick Ct
- 4 S Dakota Ave
- 1090 Bennetts Mills Rd
- 50 Knightsbridge Place
- 85 Hampshire Blvd
- 87 Hampshire Blvd
- 30 Piccadilly Dr
- 54 Knightsbridge Place
- 1 Kari Ct
- 1054 Bennetts Mills Rd
Your Personal Tour Guide
Ask me questions while you tour the home.