L
Seller's Agent in 2022
Lori Brooks
HIGH COUNTRY REALTY, INC
(435) 590-4944
4 in this area
166 Total Sales
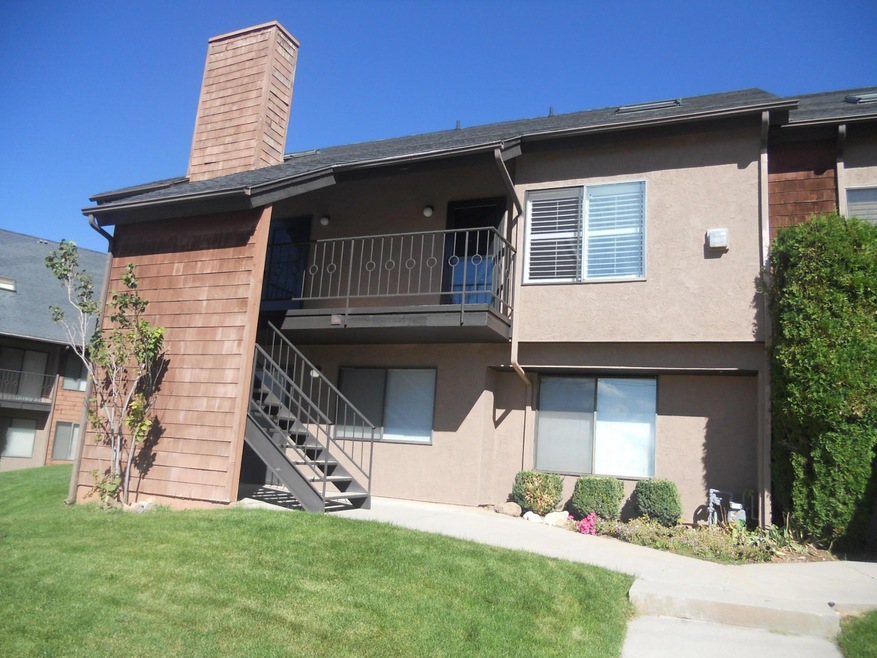
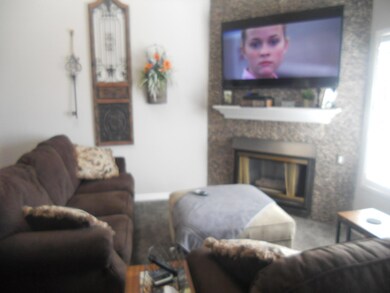
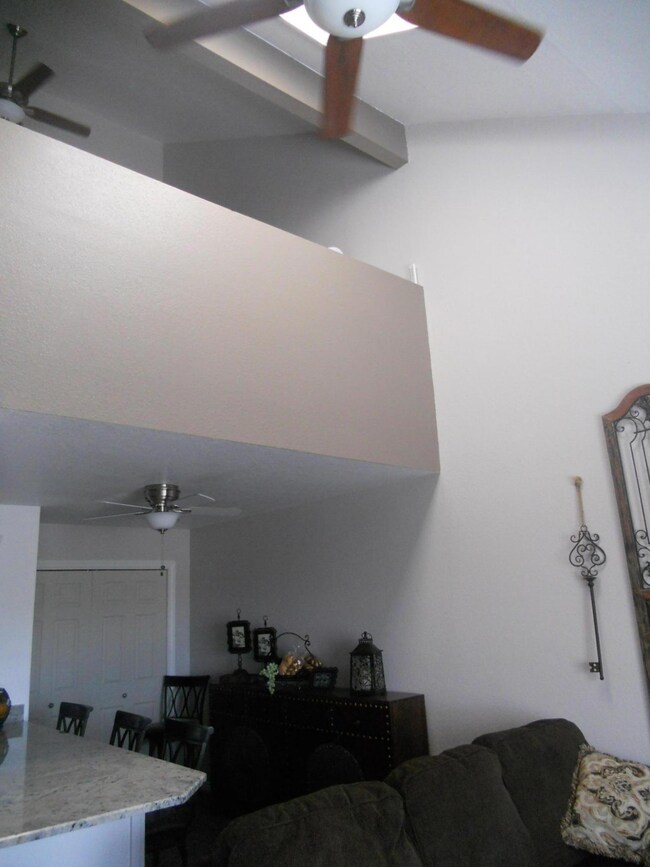
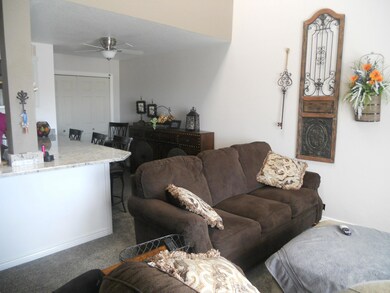
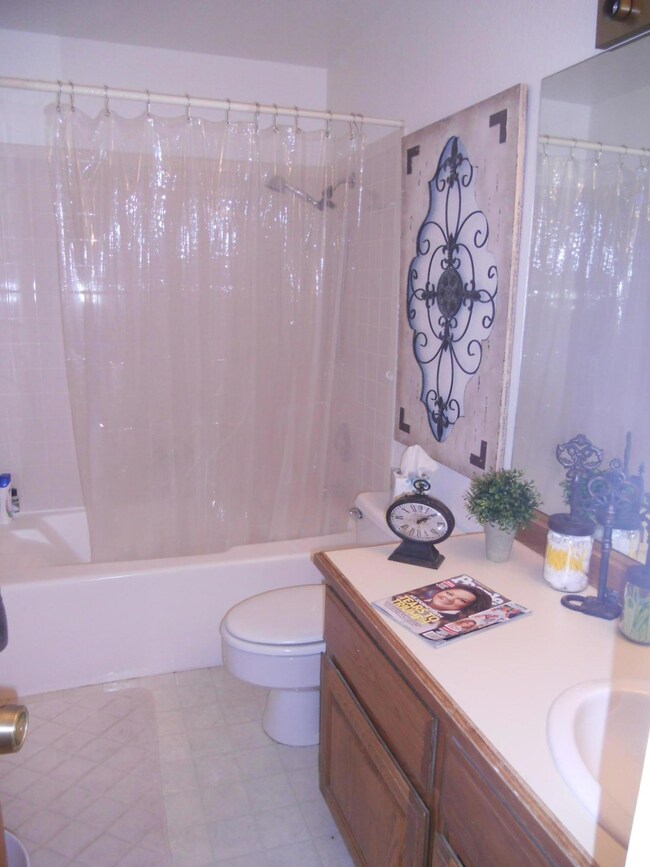
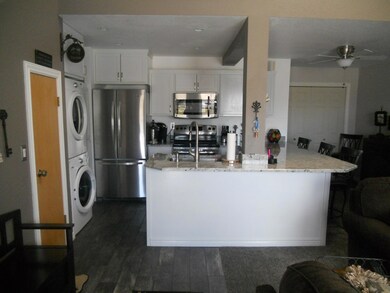
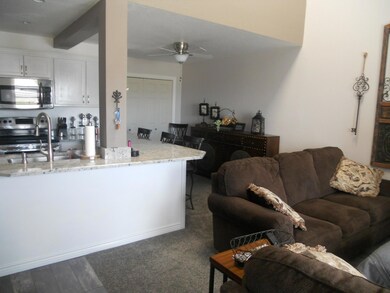
This Shinglebrook Condo is beautiful. It has been remodeled and very nicely done, The kitchen has been opened up to the living area. It has a large beautiful granite bar, new stainless steel appliances, stackable washer and dryer, tile (looks like wood)floor, new carpet through out. The rock fire place is not only beautiful but serves as a sufficient source of heat. being a middle unit you don't have to worry with freezing problems in the winter. A beautiful home worth seeing soon. Don't miss this deal!! At the mouth of the canyon, easy access to Brian Head Ski Resort!!
Last Agent to Sell the Property
SHERRI CARLSON
High Country Realty-Parowan Listed on: 06/20/2015
Last Buyer's Agent
SHERRI CARLSON
Cedar City Real Estate
| Date | Type | Sale Price | Title Company |
|---|---|---|---|
| Warranty Deed | -- | -- |
| Date | Status | Loan Amount | Loan Type |
|---|---|---|---|
| Closed | $140,000 | New Conventional |
| Date | Event | Price | Change | Sq Ft Price |
|---|---|---|---|---|
| 09/27/2022 09/27/22 | Sold | -- | -- | -- |
| 08/25/2022 08/25/22 | Pending | -- | -- | -- |
| 05/20/2022 05/20/22 | For Sale | $179,999 | +125.0% | $268 / Sq Ft |
| 11/13/2020 11/13/20 | Sold | -- | -- | -- |
| 11/02/2020 11/02/20 | Sold | -- | -- | -- |
| 10/11/2020 10/11/20 | Pending | -- | -- | -- |
| 10/09/2020 10/09/20 | For Sale | $80,000 | -27.3% | $154 / Sq Ft |
| 09/16/2020 09/16/20 | Pending | -- | -- | -- |
| 08/26/2020 08/26/20 | Sold | -- | -- | -- |
| 07/23/2020 07/23/20 | Pending | -- | -- | -- |
| 03/10/2020 03/10/20 | For Sale | $110,000 | -18.2% | $101 / Sq Ft |
| 10/09/2019 10/09/19 | For Sale | $134,500 | +79.6% | $84 / Sq Ft |
| 11/11/2017 11/11/17 | Sold | -- | -- | -- |
| 09/21/2017 09/21/17 | Pending | -- | -- | -- |
| 09/13/2017 09/13/17 | Sold | -- | -- | -- |
| 08/24/2017 08/24/17 | For Sale | $74,900 | -4.6% | $104 / Sq Ft |
| 08/21/2017 08/21/17 | Pending | -- | -- | -- |
| 04/27/2017 04/27/17 | For Sale | $78,500 | +40.4% | $109 / Sq Ft |
| 08/31/2015 08/31/15 | Sold | -- | -- | -- |
| 08/03/2015 08/03/15 | Pending | -- | -- | -- |
| 07/30/2015 07/30/15 | Sold | -- | -- | -- |
| 07/03/2015 07/03/15 | Sold | -- | -- | -- |
| 06/29/2015 06/29/15 | Pending | -- | -- | -- |
| 06/15/2015 06/15/15 | Pending | -- | -- | -- |
| 02/11/2015 02/11/15 | For Sale | $55,900 | +11.8% | $78 / Sq Ft |
| 10/11/2014 10/11/14 | For Sale | $50,000 | +61.3% | $69 / Sq Ft |
| 06/13/2014 06/13/14 | Sold | -- | -- | -- |
| 05/28/2014 05/28/14 | Pending | -- | -- | -- |
| 05/28/2014 05/28/14 | For Sale | $31,000 | -51.9% | $57 / Sq Ft |
| 02/18/2014 02/18/14 | For Sale | $64,500 | +29.3% | $59 / Sq Ft |
| 01/07/2014 01/07/14 | Sold | -- | -- | -- |
| 12/22/2013 12/22/13 | Pending | -- | -- | -- |
| 12/01/2013 12/01/13 | Sold | -- | -- | -- |
| 11/01/2013 11/01/13 | Pending | -- | -- | -- |
| 02/14/2013 02/14/13 | For Sale | $49,900 | -5.7% | $69 / Sq Ft |
| 07/20/2012 07/20/12 | Sold | -- | -- | -- |
| 07/06/2012 07/06/12 | Pending | -- | -- | -- |
| 01/05/2012 01/05/12 | For Sale | $52,900 | -8.0% | $73 / Sq Ft |
| 05/22/2011 05/22/11 | For Sale | $57,500 | -- | $111 / Sq Ft |
| Year | Tax Paid | Tax Assessment Tax Assessment Total Assessment is a certain percentage of the fair market value that is determined by local assessors to be the total taxable value of land and additions on the property. | Land | Improvement |
|---|---|---|---|---|
| 2023 | $645 | $80,010 | $2,020 | $77,990 |
| 2022 | $696 | $72,740 | $1,840 | $70,900 |
| 2021 | $696 | $72,740 | $1,840 | $70,900 |
| 2020 | $788 | $72,740 | $1,840 | $70,900 |
| 2019 | $826 | $72,740 | $1,840 | $70,900 |
| 2018 | $841 | $72,500 | $1,600 | $70,900 |
| 2017 | $718 | $60,340 | $1,600 | $58,740 |
| 2016 | $691 | $55,000 | $1,600 | $53,400 |
| 2015 | $997 | $75,000 | $0 | $0 |
| 2014 | $1,046 | $75,000 | $0 | $0 |
L
Seller's Agent in 2022
Lori Brooks
HIGH COUNTRY REALTY, INC
(435) 590-4944
4 in this area
166 Total Sales
K
Buyer's Agent in 2022
KELLY MARSHALL
High Country Realty-South Brian Head
(435) 592-5431
3 in this area
177 Total Sales
C
Seller's Agent in 2020
Chanda Messerly
ERA Realty Center
(435) 477-2693
1 in this area
21 Total Sales
J
Seller's Agent in 2020
Janice Steffensen
J&E Property Management and Sales LLC

Seller's Agent in 2020
Rene' Cole
RE/MAX
5 in this area
82 Total Sales
B
Buyer's Agent in 2020
Bryan Burnett
Century 21 Everest (Iron)
Source: Iron County Board of REALTORS®
MLS Number: 69780
APN: A-0514-0003-0001-09B