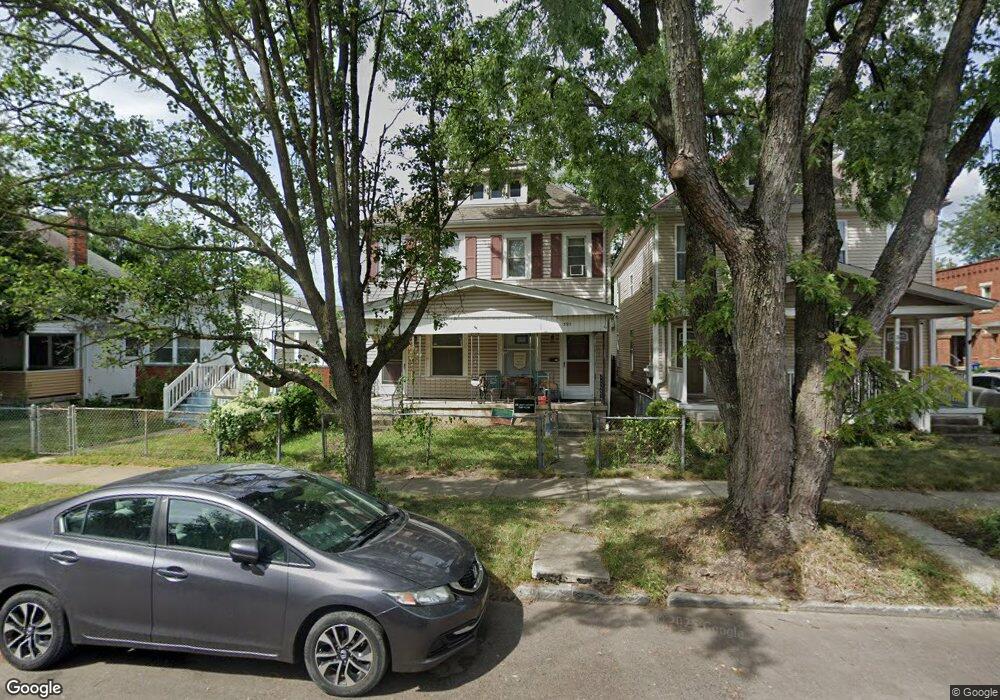
390 E Mithoff St Unit 392 Columbus, OH 43206
Merion Village NeighborhoodEstimated Value: $371,000 - $484,000
6
Beds
2
Baths
2,178
Sq Ft
$197/Sq Ft
Est. Value
About This Home
This home is located at 390 E Mithoff St Unit 392, Columbus, OH 43206 and is currently estimated at $428,552, approximately $196 per square foot. 390 E Mithoff St Unit 392 is a home located in Franklin County with nearby schools including Siebert Elementary School, South High School, and South Columbus Preparatory Academy.
Ownership History
Date
Name
Owned For
Owner Type
Purchase Details
Closed on
May 12, 2015
Sold by
C & R Ball Family Limited Partnership V
Bought by
Mid-State Holdings I Llc
Current Estimated Value
Create a Home Valuation Report for This Property
The Home Valuation Report is an in-depth analysis detailing your home's value as well as a comparison with similar homes in the area
Home Values in the Area
Average Home Value in this Area
Purchase History
| Date | Buyer | Sale Price | Title Company |
|---|---|---|---|
| Mid-State Holdings I Llc | -- | None Available |
Source: Public Records
Tax History Compared to Growth
Tax History
| Year | Tax Paid | Tax Assessment Tax Assessment Total Assessment is a certain percentage of the fair market value that is determined by local assessors to be the total taxable value of land and additions on the property. | Land | Improvement |
|---|---|---|---|---|
| 2024 | $5,085 | $110,960 | $41,480 | $69,480 |
| 2023 | $5,022 | $110,950 | $41,475 | $69,475 |
| 2022 | $4,662 | $87,300 | $37,210 | $50,090 |
| 2021 | $4,648 | $87,300 | $37,210 | $50,090 |
| 2020 | $4,655 | $87,300 | $37,210 | $50,090 |
| 2019 | $4,323 | $69,520 | $37,210 | $32,310 |
| 2018 | $3,651 | $69,520 | $37,210 | $32,310 |
| 2017 | $4,322 | $69,520 | $37,210 | $32,310 |
| 2016 | $3,329 | $48,270 | $20,410 | $27,860 |
| 2015 | $2,986 | $48,270 | $20,410 | $27,860 |
| 2014 | $2,993 | $48,270 | $20,410 | $27,860 |
| 2013 | $1,342 | $43,890 | $18,550 | $25,340 |
Source: Public Records
Map
Nearby Homes
- 389 E Mithoff St
- 1252 Parsons Ave
- 515 E Mithoff St
- 320 E Mithoff St
- 1274 Wager St
- 1218 Bruck St
- 1178 Wager St
- 531 E Deshler Ave
- 1106-1116 Parsons Ave
- 565 E Mithoff St
- 520 Cline St
- 524 Thurman Ave
- 523 Hanford St
- 325 Frebis Ave
- 554 Hanford St
- 348-350 E Moler St
- 546 Frebis Ave
- 1240 S 17th St
- 530 E Moler St
- 479 Siebert St
- 388 E Mithoff St
- 394 E Mithoff St Unit 396
- 394 E Mithoff St Unit 6
- 384 E Mithoff St
- 378 E Mithoff St Unit 380
- 1218 S Washington Ave
- 1224 S Washington Ave Unit 1224
- 1212 S Washington Ave Unit 1212
- 374 E Mithoff St Unit 376
- 1226 S Washington Ave
- 1222 S Washington Ave
- 1220 S Washington Ave
- 1214 S Washington Ave
- 1205 S Washington Ave Unit B
- 1205 S Washington Ave
- 372 E Mithoff St
- 393 E Mithoff St
- 385 E Mithoff St
- 381 E Mithoff St
- 1208 S Washington Ave