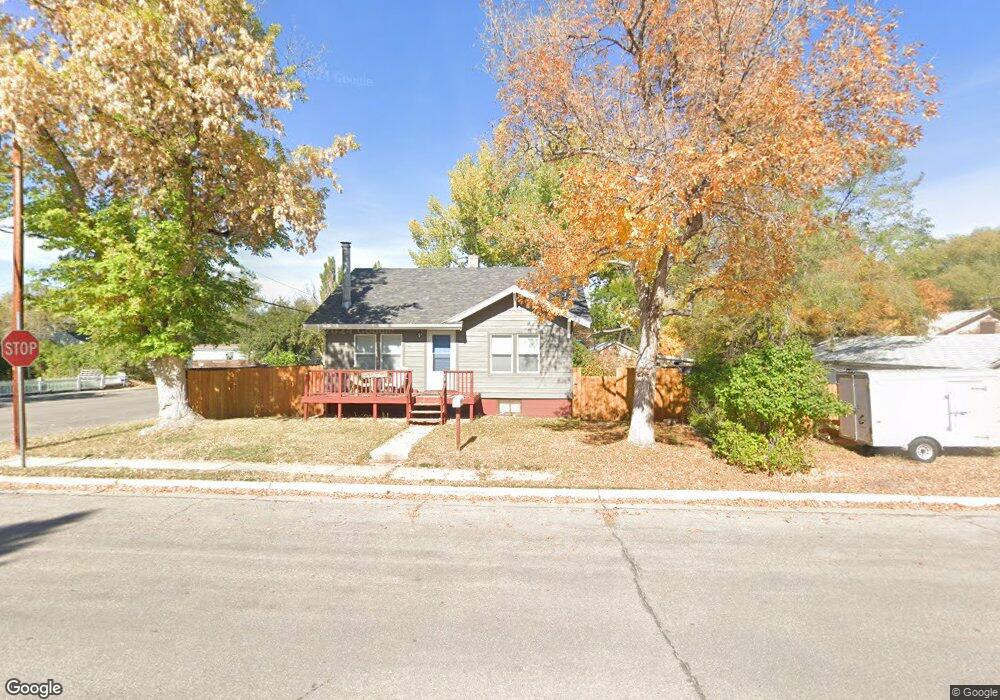
390 Eugene St Lander, WY 82520
Estimated Value: $228,716 - $277,000
2
Beds
1
Bath
840
Sq Ft
$299/Sq Ft
Est. Value
About This Home
This home is located at 390 Eugene St, Lander, WY 82520 and is currently estimated at $251,179, approximately $299 per square foot. 390 Eugene St is a home located in Fremont County with nearby schools including Lander Valley High School and Lander Christian Academy.
Ownership History
Date
Name
Owned For
Owner Type
Purchase Details
Closed on
Feb 17, 2017
Sold by
Wyoming Property Investments
Bought by
Barton Andrew M
Current Estimated Value
Home Financials for this Owner
Home Financials are based on the most recent Mortgage that was taken out on this home.
Original Mortgage
$47,600
Outstanding Balance
$39,411
Interest Rate
4.2%
Mortgage Type
New Conventional
Estimated Equity
$211,768
Purchase Details
Closed on
Oct 24, 2016
Sold by
Folston Gary L
Bought by
Wyoming Property Investments
Create a Home Valuation Report for This Property
The Home Valuation Report is an in-depth analysis detailing your home's value as well as a comparison with similar homes in the area
Home Values in the Area
Average Home Value in this Area
Purchase History
| Date | Buyer | Sale Price | Title Company |
|---|---|---|---|
| Barton Andrew M | -- | County Title Inc Folder | |
| Wyoming Property Investments | $52,091 | None Available |
Source: Public Records
Mortgage History
| Date | Status | Borrower | Loan Amount |
|---|---|---|---|
| Open | Barton Andrew M | $47,600 |
Source: Public Records
Tax History
| Year | Tax Paid | Tax Assessment Tax Assessment Total Assessment is a certain percentage of the fair market value that is determined by local assessors to be the total taxable value of land and additions on the property. | Land | Improvement |
|---|---|---|---|---|
| 2025 | $1,363 | $13,584 | $4,239 | $9,345 |
| 2024 | $1,363 | $17,660 | $5,653 | $12,007 |
| 2023 | $1,280 | $16,714 | $5,149 | $11,565 |
| 2022 | $851 | $11,357 | $5,149 | $6,208 |
| 2021 | $795 | $10,264 | $4,777 | $5,487 |
| 2020 | $760 | $9,833 | $4,777 | $5,056 |
| 2019 | $753 | $9,591 | $4,777 | $4,814 |
| 2018 | $740 | $9,325 | $4,798 | $4,527 |
| 2017 | $732 | $9,195 | $4,798 | $4,397 |
| 2016 | $1,092 | $13,741 | $4,798 | $8,943 |
| 2015 | $998 | $12,698 | $4,798 | $7,900 |
| 2014 | $979 | $12,479 | $4,798 | $7,681 |
Source: Public Records
Map
Nearby Homes
- 764 N 4th St
- 537 Market St
- 106 Rail Ln
- 625 Cottonwood Ln
- 1105 N 2nd St
- 766 Victory Ln
- 787 Victory Ln
- 617 Main St Unit LotWP001
- 980 Riverview Dr
- 360 N 9th St
- 824 Main St
- 1100 Pronghorn Dr
- 350 Canyon St
- 695 N 9th St
- 1072 Pronghorn Dr
- 835 Garfield St
- 1062 Pronghorn Dr
- 108 Canyon St
- 400 S 1st St
- 1530 W Main St
Your Personal Tour Guide
Ask me questions while you tour the home.