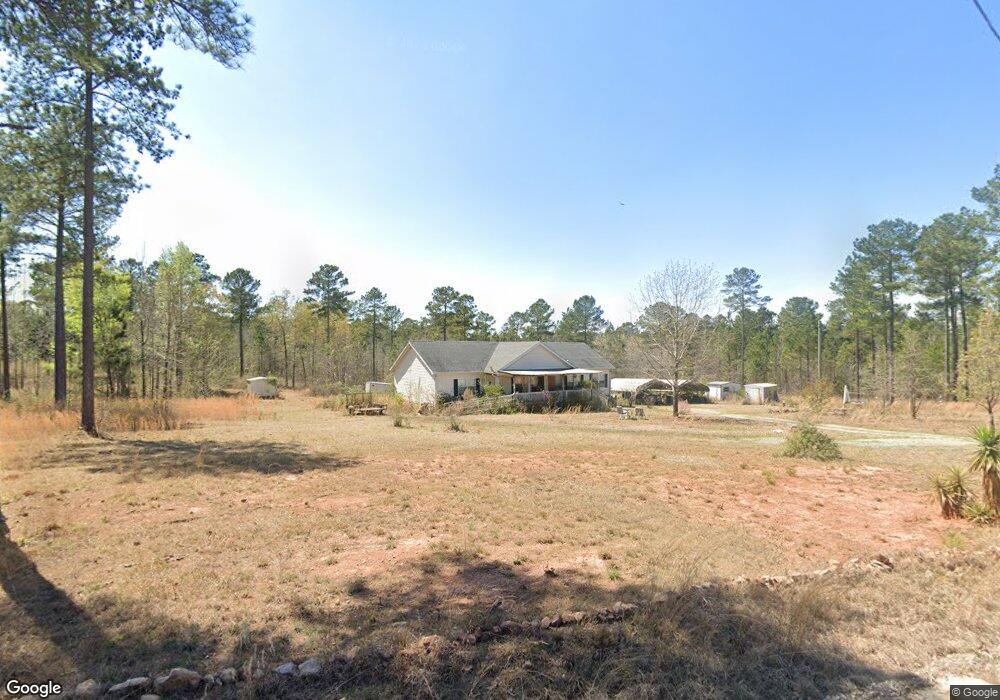
390 Firetower Rd Hillsboro, GA 31038
Estimated Value: $149,000 - $316,000
--
Bed
--
Bath
1,728
Sq Ft
$140/Sq Ft
Est. Value
About This Home
This home is located at 390 Firetower Rd, Hillsboro, GA 31038 and is currently estimated at $241,168, approximately $139 per square foot. 390 Firetower Rd is a home with nearby schools including Putnam County Primary School, Putnam County Elementary School, and Putnam County Middle School.
Ownership History
Date
Name
Owned For
Owner Type
Purchase Details
Closed on
Sep 22, 2008
Sold by
Not Provided
Bought by
Thomas John W and Thomas Betty M
Current Estimated Value
Create a Home Valuation Report for This Property
The Home Valuation Report is an in-depth analysis detailing your home's value as well as a comparison with similar homes in the area
Home Values in the Area
Average Home Value in this Area
Purchase History
| Date | Buyer | Sale Price | Title Company |
|---|---|---|---|
| Thomas John W | $24,900 | -- |
Source: Public Records
Tax History Compared to Growth
Tax History
| Year | Tax Paid | Tax Assessment Tax Assessment Total Assessment is a certain percentage of the fair market value that is determined by local assessors to be the total taxable value of land and additions on the property. | Land | Improvement |
|---|---|---|---|---|
| 2024 | $1,618 | $85,470 | $11,380 | $74,090 |
| 2023 | $1,472 | $82,453 | $9,645 | $72,808 |
| 2022 | $1,187 | $59,124 | $6,938 | $52,186 |
| 2021 | $1,367 | $60,001 | $10,269 | $49,732 |
| 2020 | $1,130 | $59,623 | $10,269 | $49,354 |
| 2019 | $1,130 | $45,959 | $5,140 | $40,819 |
| 2018 | $1,019 | $40,780 | $5,140 | $35,640 |
| 2017 | $920 | $40,780 | $5,140 | $35,640 |
| 2016 | $920 | $40,780 | $5,140 | $35,640 |
| 2015 | -- | $40,780 | $5,140 | $35,641 |
| 2014 | -- | $40,781 | $5,140 | $35,641 |
Source: Public Records
Map
Nearby Homes
- 252 Rabbit Skip Rd SW
- 377 Hillsboro Lake Rd
- 185 Old Eatonton Rd
- 104 Lo Valley Dr
- 169 Twilight Shores Rd
- 119 Shoals Point
- 310 Old MacOn Rd
- 210 Twilight Shores Dr
- 169 Twilight Shores Dr
- 400 Wehunt Rd
- 252 Twilight Shores Dr
- 253 Twilight Shores Rd
- 2246 Highway 11 S
- 4760 Jordan Rd
- 0 Landing Dr SW Unit 23668133
- 0 Anchor Pointe Dr Unit LOT 11 10609209
- 66 Franklin Rd SW
- 62 & 63 Anchore Pointe Dr
- 114 Allens Aly
- 2683 Greer Rd