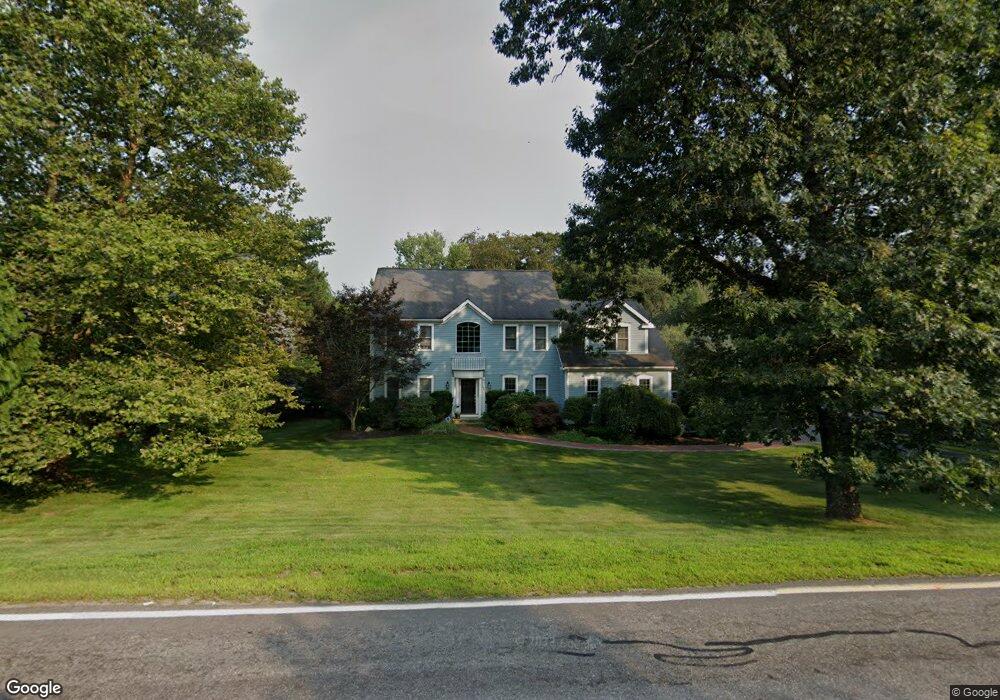
390 Hudson St Northborough, MA 01532
Estimated Value: $982,000 - $1,136,000
4
Beds
3
Baths
2,732
Sq Ft
$379/Sq Ft
Est. Value
About This Home
This home is located at 390 Hudson St, Northborough, MA 01532 and is currently estimated at $1,035,855, approximately $379 per square foot. 390 Hudson St is a home located in Worcester County with nearby schools including Marion E. Zeh Elementary School, Robert E. Melican Middle School, and Algonquin Regional High School.
Ownership History
Date
Name
Owned For
Owner Type
Purchase Details
Closed on
Apr 26, 2001
Sold by
Brossi Joseph A
Bought by
Brossi William F
Current Estimated Value
Home Financials for this Owner
Home Financials are based on the most recent Mortgage that was taken out on this home.
Original Mortgage
$275,000
Outstanding Balance
$101,544
Interest Rate
6.88%
Mortgage Type
Purchase Money Mortgage
Estimated Equity
$934,311
Create a Home Valuation Report for This Property
The Home Valuation Report is an in-depth analysis detailing your home's value as well as a comparison with similar homes in the area
Home Values in the Area
Average Home Value in this Area
Purchase History
| Date | Buyer | Sale Price | Title Company |
|---|---|---|---|
| Brossi William F | $52,500 | -- |
Source: Public Records
Mortgage History
| Date | Status | Borrower | Loan Amount |
|---|---|---|---|
| Open | Brossi William F | $30,000 | |
| Open | Brossi William F | $275,000 |
Source: Public Records
Tax History Compared to Growth
Tax History
| Year | Tax Paid | Tax Assessment Tax Assessment Total Assessment is a certain percentage of the fair market value that is determined by local assessors to be the total taxable value of land and additions on the property. | Land | Improvement |
|---|---|---|---|---|
| 2025 | $12,822 | $899,800 | $296,500 | $603,300 |
| 2024 | $11,894 | $832,900 | $236,700 | $596,200 |
| 2023 | $11,237 | $759,800 | $223,200 | $536,600 |
| 2022 | $10,687 | $648,100 | $212,600 | $435,500 |
| 2021 | $10,354 | $604,800 | $193,400 | $411,400 |
| 2020 | $10,491 | $608,200 | $182,500 | $425,700 |
| 2019 | $10,191 | $594,200 | $177,200 | $417,000 |
| 2018 | $9,827 | $565,100 | $173,500 | $391,600 |
| 2017 | $9,592 | $551,600 | $173,500 | $378,100 |
| 2016 | $9,912 | $577,300 | $170,100 | $407,200 |
| 2015 | $8,773 | $524,400 | $178,200 | $346,200 |
| 2014 | $8,358 | $503,800 | $178,200 | $325,600 |
Source: Public Records
Map
Nearby Homes
- 13 Deacon St
- 490 Main St Unit 301
- 490 Main St Unit 101
- 18 Alden Dr Unit 3
- 405 Whitney St
- 460 Whitney St
- 14 Vanessa Dr
- 281 Whitney St
- 6 Vanessa Dr
- 204 Whitney St
- 6 Macalister Dr
- 6 Silas Dr
- 54 Evelina Dr
- 28 Evelina Dr
- 85 Hudson St Unit 85
- 0 Newton St
- 129 Bartlett St
- 107 Washburn St
- 86 Whitney St
- 75 Newton St