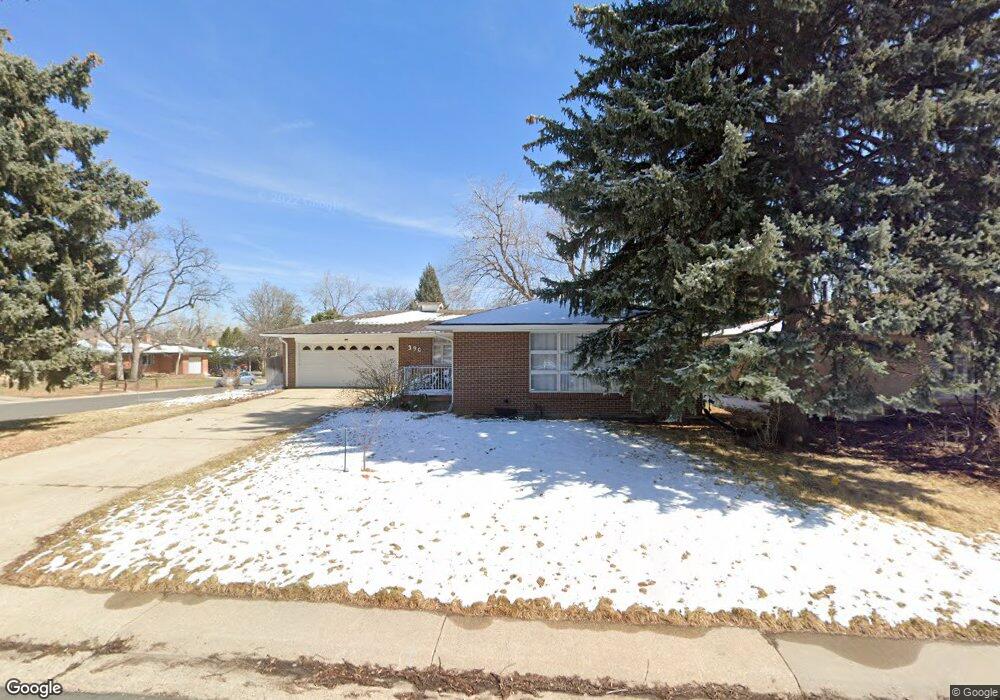
390 Iris St Broomfield, CO 80020
Broomfield Heights NeighborhoodEstimated Value: $534,230 - $569,000
3
Beds
3
Baths
2,256
Sq Ft
$244/Sq Ft
Est. Value
About This Home
This home is located at 390 Iris St, Broomfield, CO 80020 and is currently estimated at $550,808, approximately $244 per square foot. 390 Iris St is a home located in Broomfield County with nearby schools including Broomfield Heights Middle School, Broomfield High School, and Nativity: Faith and Reason.
Ownership History
Date
Name
Owned For
Owner Type
Purchase Details
Closed on
Aug 17, 2016
Sold by
Hazlitt Christopher M and Hazlitt Marcia J
Bought by
Broomeield John H
Current Estimated Value
Home Financials for this Owner
Home Financials are based on the most recent Mortgage that was taken out on this home.
Original Mortgage
$243,750
Outstanding Balance
$194,043
Interest Rate
3.41%
Mortgage Type
New Conventional
Estimated Equity
$356,765
Purchase Details
Closed on
Jul 1, 2016
Sold by
Patterson Bradley W
Bought by
Hazlitt Christopher M
Home Financials for this Owner
Home Financials are based on the most recent Mortgage that was taken out on this home.
Original Mortgage
$243,750
Outstanding Balance
$194,043
Interest Rate
3.41%
Mortgage Type
New Conventional
Estimated Equity
$356,765
Purchase Details
Closed on
Dec 15, 2006
Sold by
Patterson William
Bought by
Patterson William Emery
Purchase Details
Closed on
Jan 10, 1977
Create a Home Valuation Report for This Property
The Home Valuation Report is an in-depth analysis detailing your home's value as well as a comparison with similar homes in the area
Home Values in the Area
Average Home Value in this Area
Purchase History
| Date | Buyer | Sale Price | Title Company |
|---|---|---|---|
| Broomeield John H | $361,639 | Land Title Guarantee | |
| Hazlitt Christopher M | $359,500 | None Available | |
| Patterson William Emery | -- | None Available | |
| -- | -- | -- |
Source: Public Records
Mortgage History
| Date | Status | Borrower | Loan Amount |
|---|---|---|---|
| Open | Broomeield John H | $243,750 |
Source: Public Records
Tax History
| Year | Tax Paid | Tax Assessment Tax Assessment Total Assessment is a certain percentage of the fair market value that is determined by local assessors to be the total taxable value of land and additions on the property. | Land | Improvement |
|---|---|---|---|---|
| 2025 | $3,246 | $35,760 | $9,050 | $26,710 |
| 2024 | $3,246 | $34,640 | $8,180 | $26,460 |
| 2023 | $3,239 | $39,750 | $9,380 | $30,370 |
| 2022 | $2,748 | $28,430 | $6,600 | $21,830 |
| 2021 | $2,735 | $29,250 | $6,790 | $22,460 |
| 2020 | $2,560 | $27,210 | $6,080 | $21,130 |
| 2019 | $2,555 | $27,390 | $6,120 | $21,270 |
| 2018 | $2,100 | $22,250 | $4,570 | $17,680 |
| 2017 | $2,068 | $24,600 | $5,050 | $19,550 |
| 2016 | $1,809 | $19,180 | $5,050 | $14,130 |
| 2015 | $1,022 | $15,520 | $5,050 | $10,470 |
| 2014 | $722 | $15,520 | $5,050 | $10,470 |
Source: Public Records
Map
Nearby Homes
- 345 Hemlock St
- 325 Jade St
- 265 Laurel St
- 215 Beryl Way
- 370 Coral St
- 123 Emerald St
- 870 Hemlock Way
- 740 Lotus Way
- 820 Lotus Way
- 8005 Emerald Ln
- 250 W Midway Blvd
- 11800 Colmans Way Unit 16
- 1085 Kohl St
- 1422 Madero St Unit C17
- 6801 W 118th Ave
- 1080 Opal St Unit 104
- 1166 Opal St Unit 104
- 1018 Depot Hill Rd
- 1130 Opal St Unit 104
- 1320 Holly Dr E
Your Personal Tour Guide
Ask me questions while you tour the home.