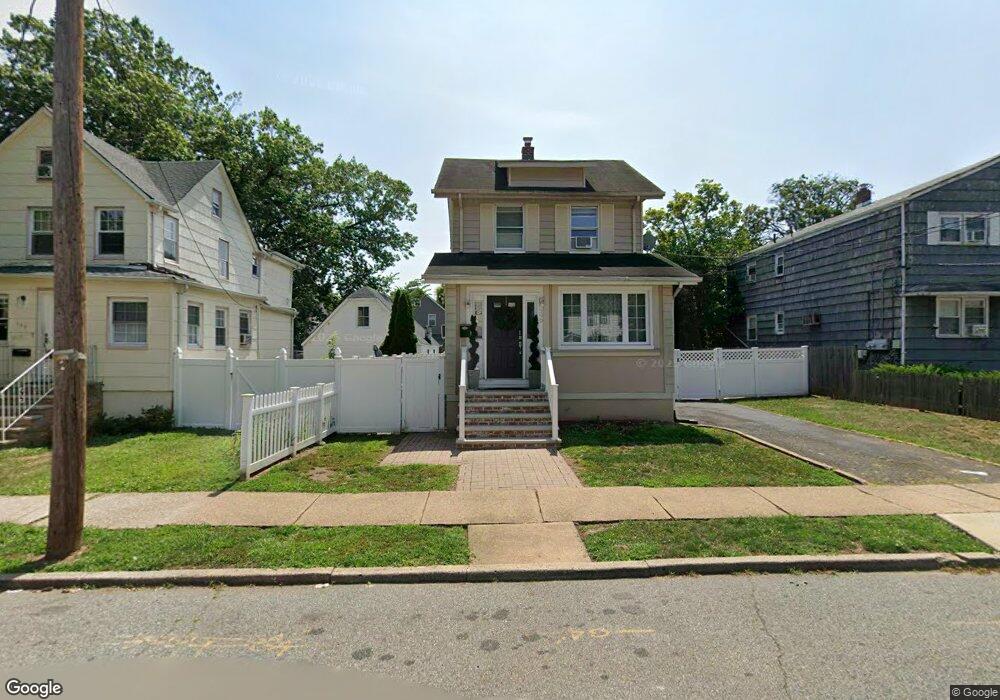
390 Kipp St Teaneck, NJ 07666
Estimated Value: $578,377 - $686,000
Studio
--
Bath
1,784
Sq Ft
$355/Sq Ft
Est. Value
About This Home
This home is located at 390 Kipp St, Teaneck, NJ 07666 and is currently estimated at $633,094, approximately $354 per square foot. 390 Kipp St is a home located in Bergen County with nearby schools including Teaneck Senior High School, Teaneck Community Charter School, and Bogota Middle School.
Ownership History
Date
Name
Owned For
Owner Type
Purchase Details
Closed on
Jan 24, 2006
Current Estimated Value
Purchase Details
Closed on
Nov 3, 2004
Sold by
Zajac Leszek
Bought by
Guichardo Guillermo Jose
Home Financials for this Owner
Home Financials are based on the most recent Mortgage that was taken out on this home.
Original Mortgage
$306,850
Interest Rate
5.8%
Purchase Details
Closed on
Apr 23, 2004
Sold by
Bk One Natl Assn
Bought by
Zajac Leszek
Home Financials for this Owner
Home Financials are based on the most recent Mortgage that was taken out on this home.
Original Mortgage
$160,000
Interest Rate
5.47%
Create a Home Valuation Report for This Property
The Home Valuation Report is an in-depth analysis detailing your home's value as well as a comparison with similar homes in the area
Home Values in the Area
Average Home Value in this Area
Purchase History
| Date | Buyer | Sale Price | Title Company |
|---|---|---|---|
| -- | -- | -- | |
| Guichardo Guillermo Jose | $323,000 | -- | |
| Zajac Leszek | $205,000 | -- |
Source: Public Records
Mortgage History
| Date | Status | Borrower | Loan Amount |
|---|---|---|---|
| Previous Owner | Guichardo Guillermo Jose | $306,850 | |
| Previous Owner | Zajac Leszek | $160,000 |
Source: Public Records
Tax History
| Year | Tax Paid | Tax Assessment Tax Assessment Total Assessment is a certain percentage of the fair market value that is determined by local assessors to be the total taxable value of land and additions on the property. | Land | Improvement |
|---|---|---|---|---|
| 2025 | $10,879 | $498,100 | $257,900 | $240,200 |
| 2024 | $9,222 | $498,100 | $257,900 | $240,200 |
| 2023 | $9,041 | $279,300 | $158,900 | $120,400 |
| 2022 | $9,041 | $279,300 | $158,900 | $120,400 |
| 2021 | $9,094 | $279,300 | $158,900 | $120,400 |
| 2020 | $9,033 | $279,300 | $158,900 | $120,400 |
| 2019 | $8,929 | $279,300 | $158,900 | $120,400 |
| 2018 | $8,862 | $279,300 | $158,900 | $120,400 |
| 2017 | $8,778 | $279,300 | $158,900 | $120,400 |
| 2016 | $8,647 | $279,300 | $158,900 | $120,400 |
| 2015 | $8,510 | $279,300 | $158,900 | $120,400 |
| 2014 | $8,227 | $320,000 | $218,500 | $101,500 |
Source: Public Records
Map
Nearby Homes
Your Personal Tour Guide
Ask me questions while you tour the home.