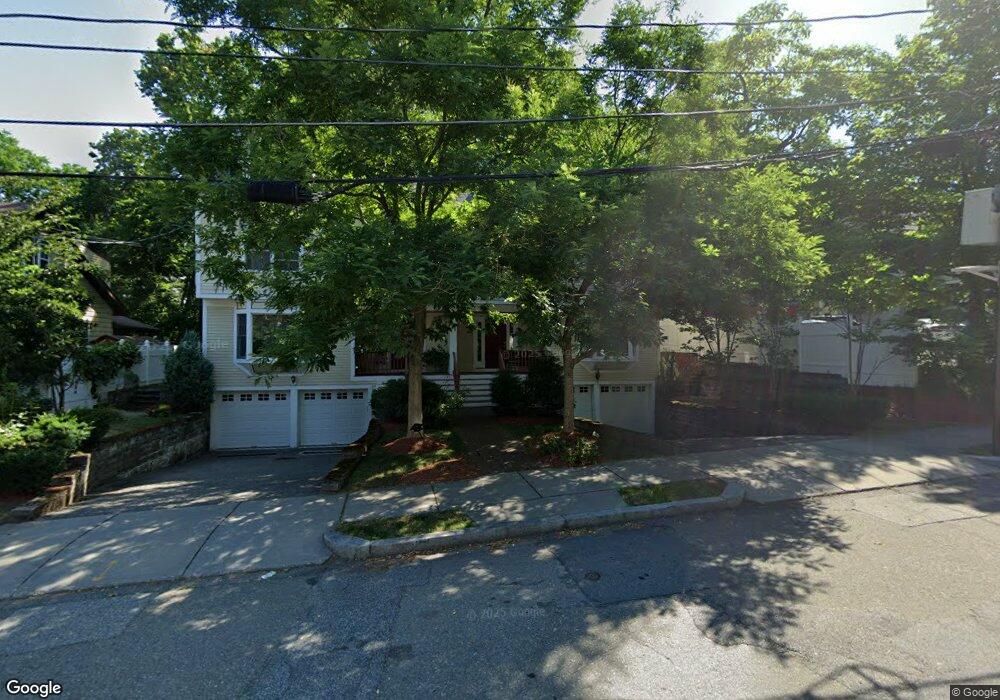
390 Linwood Ave Newtonville, MA 02460
Nonantum NeighborhoodEstimated Value: $1,302,000 - $1,435,000
4
Beds
5
Baths
2,650
Sq Ft
$524/Sq Ft
Est. Value
About This Home
This home is located at 390 Linwood Ave, Newtonville, MA 02460 and is currently estimated at $1,389,008, approximately $524 per square foot. 390 Linwood Ave is a home located in Middlesex County with nearby schools including Horace Mann Elementary School, F.A. Day Middle School, and Newton North High School.
Ownership History
Date
Name
Owned For
Owner Type
Purchase Details
Closed on
Apr 12, 2005
Sold by
Sewall Richard D
Bought by
Mandinova Anna and Mandinov Lazar
Current Estimated Value
Home Financials for this Owner
Home Financials are based on the most recent Mortgage that was taken out on this home.
Original Mortgage
$575,200
Outstanding Balance
$295,284
Interest Rate
5.7%
Mortgage Type
Purchase Money Mortgage
Estimated Equity
$1,093,724
Purchase Details
Closed on
Nov 6, 2003
Sold by
Thornton Colette and Thornton Kevin M
Bought by
Sewall Richard D
Home Financials for this Owner
Home Financials are based on the most recent Mortgage that was taken out on this home.
Original Mortgage
$712,000
Interest Rate
6.01%
Mortgage Type
Purchase Money Mortgage
Create a Home Valuation Report for This Property
The Home Valuation Report is an in-depth analysis detailing your home's value as well as a comparison with similar homes in the area
Home Values in the Area
Average Home Value in this Area
Purchase History
| Date | Buyer | Sale Price | Title Company |
|---|---|---|---|
| Mandinova Anna | $719,000 | -- | |
| Mandinova Anna | $719,000 | -- | |
| Sewall Richard D | $440,000 | -- | |
| Sewall Richard D | $440,000 | -- |
Source: Public Records
Mortgage History
| Date | Status | Borrower | Loan Amount |
|---|---|---|---|
| Open | Mandinova Anna | $575,200 | |
| Closed | Sewall Richard D | $575,200 | |
| Previous Owner | Sewall Richard D | $712,000 |
Source: Public Records
Tax History Compared to Growth
Tax History
| Year | Tax Paid | Tax Assessment Tax Assessment Total Assessment is a certain percentage of the fair market value that is determined by local assessors to be the total taxable value of land and additions on the property. | Land | Improvement |
|---|---|---|---|---|
| 2025 | $11,065 | $1,129,100 | $0 | $1,129,100 |
| 2024 | $10,699 | $1,096,200 | $0 | $1,096,200 |
| 2023 | $10,411 | $1,022,700 | $0 | $1,022,700 |
| 2022 | $10,246 | $974,000 | $0 | $974,000 |
| 2021 | $9,887 | $918,900 | $0 | $918,900 |
| 2020 | $9,593 | $918,900 | $0 | $918,900 |
| 2019 | $9,322 | $892,100 | $0 | $892,100 |
| 2018 | $9,311 | $860,500 | $0 | $860,500 |
| 2017 | $9,027 | $811,800 | $0 | $811,800 |
| 2016 | $8,634 | $758,700 | $0 | $758,700 |
| 2015 | $8,389 | $722,600 | $0 | $722,600 |
Source: Public Records
Map
Nearby Homes
- 354 Linwood Ave Unit 1
- 611 Watertown St Unit 14
- 57 Walnut St
- 32-34 Rossmere St
- 321 Albemarle Rd
- 168 Walnut St
- 43 Walker St
- 42-44 Judkins St
- 911 Washington St
- 935 Washington St Unit 8
- 286 Nevada St Unit 286
- 957 Washington St Unit 1
- 282 Nevada St Unit 282
- 11 Randlett Park
- 336 Nevada St Unit 338
- 191 Linwood Ave
- 177 Nevada St
- 77 Court St Unit 205
- 49 Hawthorn St
- 4 Wiswall St
- 392 Linwood Ave
- 384 Linwood Ave
- 382 Linwood Ave
- 629 Watertown St Unit C
- 629 Watertown St Unit B
- 629 Watertown St Unit A
- 385 Linwood Ave
- 391 Linwood Ave
- 391 Linwood Ave Unit 1
- 381 Linwood Ave Unit 383
- 381-383 Linwood Ave Unit 2
- 621 Watertown St Unit 26
- 621 Watertown St Unit 25
- 621 Watertown St Unit 24
- 621 Watertown St Unit 23
- 621 Watertown St Unit 22
- 621 Watertown St Unit 21
- 621 Watertown St Unit 20
- 621 Watertown St Unit 19
- 621 Watertown St Unit 18