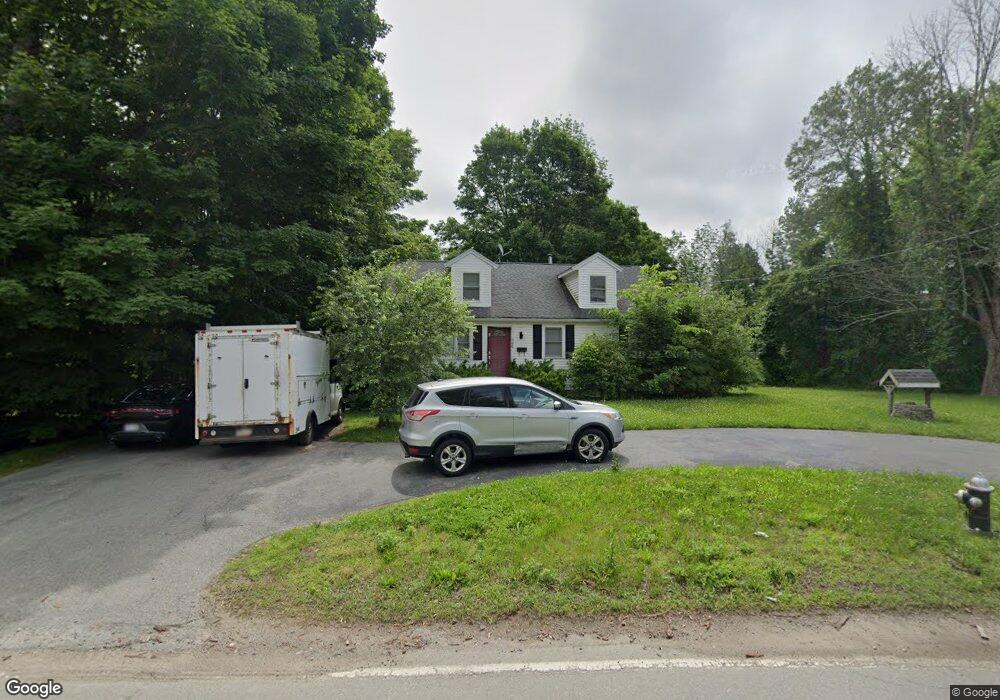
390 Linwood St Brockton, MA 02301
Clifton Heights NeighborhoodEstimated Value: $623,000 - $734,000
5
Beds
3
Baths
2,624
Sq Ft
$251/Sq Ft
Est. Value
About This Home
This home is located at 390 Linwood St, Brockton, MA 02301 and is currently estimated at $657,874, approximately $250 per square foot. 390 Linwood St is a home located in Plymouth County with nearby schools including Gilmore Elementary School, John F. Kennedy Elementary School, and Davis K-8 School.
Ownership History
Date
Name
Owned For
Owner Type
Purchase Details
Closed on
Aug 21, 2009
Sold by
Bennett Michael D and Bennett Diane
Bought by
Clancy John and Shaw Jaclyn
Current Estimated Value
Home Financials for this Owner
Home Financials are based on the most recent Mortgage that was taken out on this home.
Original Mortgage
$283,221
Interest Rate
5.19%
Mortgage Type
Purchase Money Mortgage
Purchase Details
Closed on
May 16, 1995
Sold by
Mcmurtry Gregory W
Bought by
Bennett Michael D and Bennett Diane F
Purchase Details
Closed on
Sep 21, 1990
Sold by
Spark Realty Inc
Bought by
Mcmurtry Gregory W
Purchase Details
Closed on
Sep 19, 1990
Sold by
Spark Rlty Inc
Bought by
Mcmurtry Gregory W
Create a Home Valuation Report for This Property
The Home Valuation Report is an in-depth analysis detailing your home's value as well as a comparison with similar homes in the area
Home Values in the Area
Average Home Value in this Area
Purchase History
| Date | Buyer | Sale Price | Title Company |
|---|---|---|---|
| Clancy John | $293,000 | -- | |
| Bennett Michael D | $127,000 | -- | |
| Mcmurtry Gregory W | $169,900 | -- | |
| Mcmurtry Gregory W | $169,900 | -- |
Source: Public Records
Mortgage History
| Date | Status | Borrower | Loan Amount |
|---|---|---|---|
| Open | Mcmurtry Gregory W | $285,300 | |
| Closed | Mcmurtry Gregory W | $283,221 | |
| Previous Owner | Mcmurtry Gregory W | $90,000 |
Source: Public Records
Tax History Compared to Growth
Tax History
| Year | Tax Paid | Tax Assessment Tax Assessment Total Assessment is a certain percentage of the fair market value that is determined by local assessors to be the total taxable value of land and additions on the property. | Land | Improvement |
|---|---|---|---|---|
| 2025 | $6,251 | $516,200 | $175,000 | $341,200 |
| 2024 | $5,814 | $483,700 | $175,000 | $308,700 |
| 2023 | $5,631 | $433,800 | $142,000 | $291,800 |
| 2022 | $5,306 | $379,800 | $130,000 | $249,800 |
| 2021 | $4,597 | $348,100 | $114,000 | $234,100 |
| 2020 | $5,184 | $342,200 | $109,200 | $233,000 |
| 2019 | $5,035 | $324,000 | $100,900 | $223,100 |
| 2018 | $3,520 | $282,300 | $100,900 | $181,400 |
| 2017 | $4,318 | $268,200 | $100,900 | $167,300 |
| 2016 | $4,776 | $275,100 | $97,900 | $177,200 |
| 2015 | $4,579 | $252,300 | $97,900 | $154,400 |
| 2014 | $4,413 | $243,400 | $97,900 | $145,500 |
Source: Public Records
Map
Nearby Homes