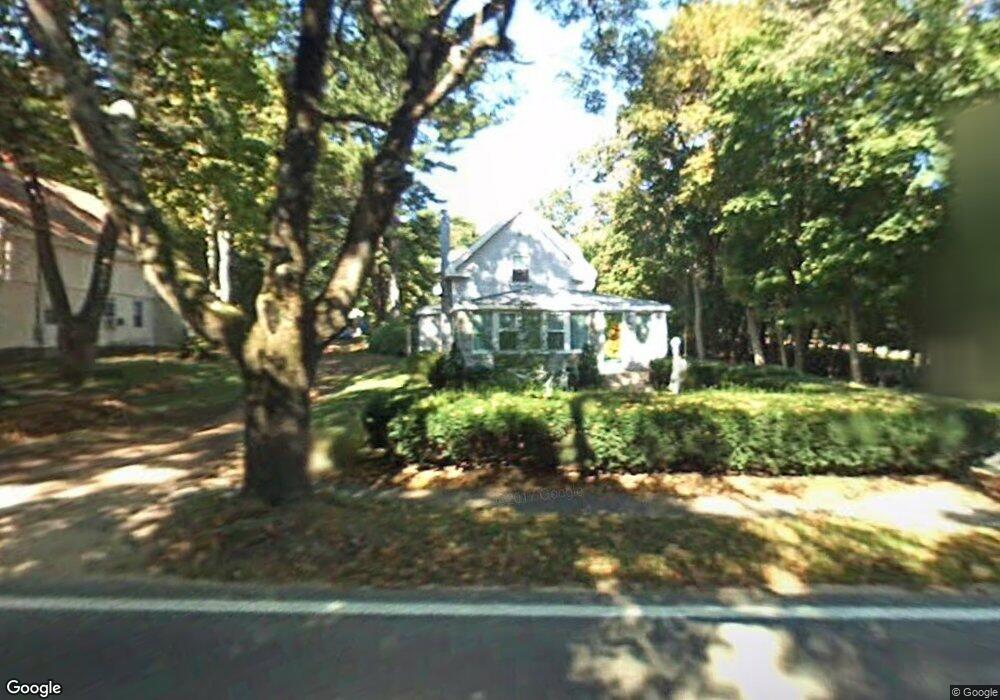
390 Matfield St West Bridgewater, MA 02379
Estimated Value: $530,000 - $577,000
3
Beds
1
Bath
1,297
Sq Ft
$426/Sq Ft
Est. Value
About This Home
This home is located at 390 Matfield St, West Bridgewater, MA 02379 and is currently estimated at $552,817, approximately $426 per square foot. 390 Matfield St is a home located in Plymouth County with nearby schools including Spring Street Elementary School, Howard Elementary School, and Rose L. MacDonald Elementary School.
Ownership History
Date
Name
Owned For
Owner Type
Purchase Details
Closed on
Aug 10, 2020
Sold by
Braddock G Allen G and Braddock Suzanne M
Bought by
Braddock Nt
Current Estimated Value
Purchase Details
Closed on
Jul 27, 1995
Sold by
Hunt Edward W and Hunt Darlene
Bought by
Braddock G Allen and Johnson Suzanne M
Purchase Details
Closed on
Oct 28, 1992
Sold by
Boyle Kevin N and Boyle Kathleen A
Bought by
Hunt Edward W and Hunt Darlene
Create a Home Valuation Report for This Property
The Home Valuation Report is an in-depth analysis detailing your home's value as well as a comparison with similar homes in the area
Home Values in the Area
Average Home Value in this Area
Purchase History
| Date | Buyer | Sale Price | Title Company |
|---|---|---|---|
| Braddock Nt | -- | None Available | |
| Braddock G Allen | $135,900 | -- | |
| Hunt Edward W | $124,900 | -- |
Source: Public Records
Mortgage History
| Date | Status | Borrower | Loan Amount |
|---|---|---|---|
| Previous Owner | Hunt Edward W | $132,500 | |
| Previous Owner | Hunt Edward W | $128,500 | |
| Previous Owner | Hunt Edward W | $75,000 |
Source: Public Records
Tax History Compared to Growth
Tax History
| Year | Tax Paid | Tax Assessment Tax Assessment Total Assessment is a certain percentage of the fair market value that is determined by local assessors to be the total taxable value of land and additions on the property. | Land | Improvement |
|---|---|---|---|---|
| 2025 | $5,863 | $428,900 | $208,800 | $220,100 |
| 2024 | $5,545 | $391,300 | $189,300 | $202,000 |
| 2023 | $5,071 | $329,900 | $163,900 | $166,000 |
| 2022 | $4,718 | $290,900 | $154,200 | $136,700 |
| 2021 | $4,747 | $284,100 | $154,200 | $129,900 |
| 2020 | $4,651 | $284,100 | $154,200 | $129,900 |
| 2019 | $4,556 | $275,600 | $154,200 | $121,400 |
| 2018 | $4,405 | $257,600 | $146,400 | $111,200 |
| 2017 | $4,220 | $238,000 | $132,700 | $105,300 |
| 2016 | $4,115 | $228,600 | $123,300 | $105,300 |
| 2015 | $4,071 | $228,600 | $123,300 | $105,300 |
| 2014 | $3,728 | $226,100 | $123,300 | $102,800 |
Source: Public Records
Map
Nearby Homes
- 382 Matfield St
- 393 Matfield St
- 378 Matfield St
- 378 Matfield St Unit 2
- 385 Matfield St
- 400 Matfield St
- 411 Matfield St
- 417 Matfield St
- 394 Matfield St
- 416 Matfield St
- 9 Arborview Terrace
- 357 Matfield St
- 7 Arborview Terrace
- 355 Matfield St
- 8 Arborview Terrace
- 345 Matfield St
- 10 Arborview Terrace
- 1 Arborview Terrace
- 131 Belmont St
- 333 Matfield St