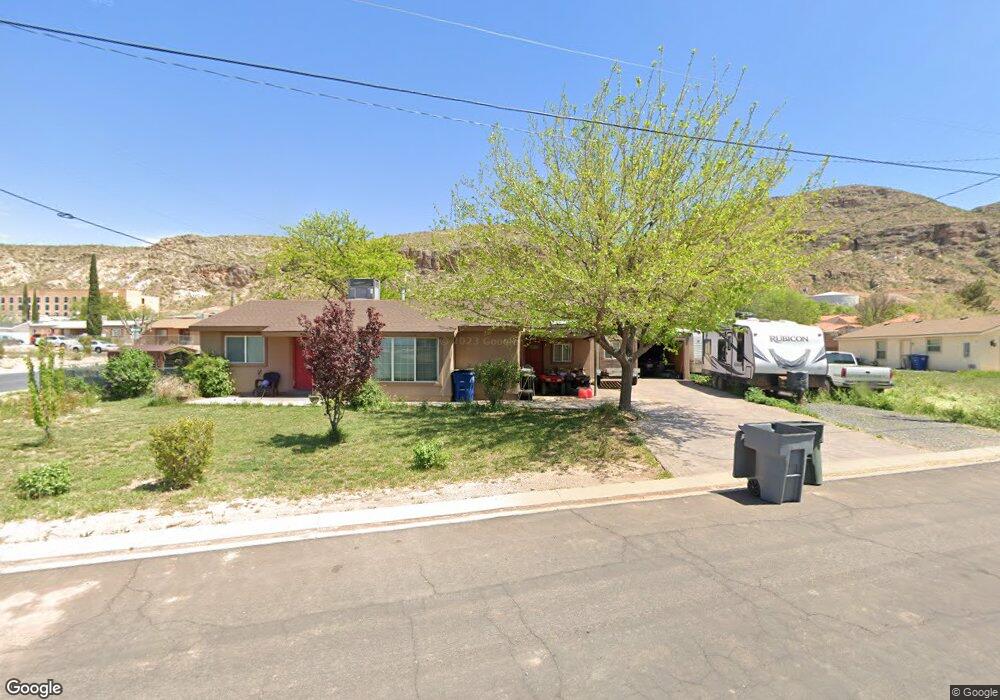
390 N 100 E La Verkin, UT 84745
Estimated Value: $312,000 - $415,000
2
Beds
1
Bath
1,129
Sq Ft
$317/Sq Ft
Est. Value
About This Home
This home is located at 390 N 100 E, La Verkin, UT 84745 and is currently estimated at $358,271, approximately $317 per square foot. 390 N 100 E is a home located in Washington County with nearby schools including La Verkin Elementary School, Hurricane Middle School, and Hurricane High School.
Ownership History
Date
Name
Owned For
Owner Type
Purchase Details
Closed on
Sep 16, 2014
Sold by
Low Michael E and Low Pamela J
Bought by
Mel Properties Llc
Current Estimated Value
Purchase Details
Closed on
Nov 13, 2012
Sold by
Barney Wendy and Cecil & Norma Rasmussen Family
Bought by
Low Michael E and Low Pamela J
Purchase Details
Closed on
May 21, 2007
Sold by
Rasmussen Norma I and Cecil & Norma Basmussen Family
Bought by
City Of Laverkin
Create a Home Valuation Report for This Property
The Home Valuation Report is an in-depth analysis detailing your home's value as well as a comparison with similar homes in the area
Home Values in the Area
Average Home Value in this Area
Purchase History
| Date | Buyer | Sale Price | Title Company |
|---|---|---|---|
| Mel Properties Llc | -- | None Available | |
| Low Michael E | -- | Southern Utah Title | |
| City Of Laverkin | -- | None Available |
Source: Public Records
Tax History
| Year | Tax Paid | Tax Assessment Tax Assessment Total Assessment is a certain percentage of the fair market value that is determined by local assessors to be the total taxable value of land and additions on the property. | Land | Improvement |
|---|---|---|---|---|
| 2025 | $1,343 | $177,265 | $59,400 | $117,865 |
| 2023 | $1,149 | $152,350 | $59,400 | $92,950 |
| 2022 | $1,149 | $143,440 | $39,600 | $103,840 |
| 2021 | $969 | $178,100 | $54,000 | $124,100 |
| 2020 | $986 | $169,300 | $54,000 | $115,300 |
| 2019 | $870 | $143,300 | $35,000 | $108,300 |
| 2018 | $752 | $60,995 | $0 | $0 |
| 2017 | $713 | $57,805 | $0 | $0 |
| 2016 | $671 | $52,250 | $0 | $0 |
| 2015 | $636 | $47,575 | $0 | $0 |
| 2014 | $585 | $43,175 | $0 | $0 |
Source: Public Records
Map
Nearby Homes
Your Personal Tour Guide
Ask me questions while you tour the home.