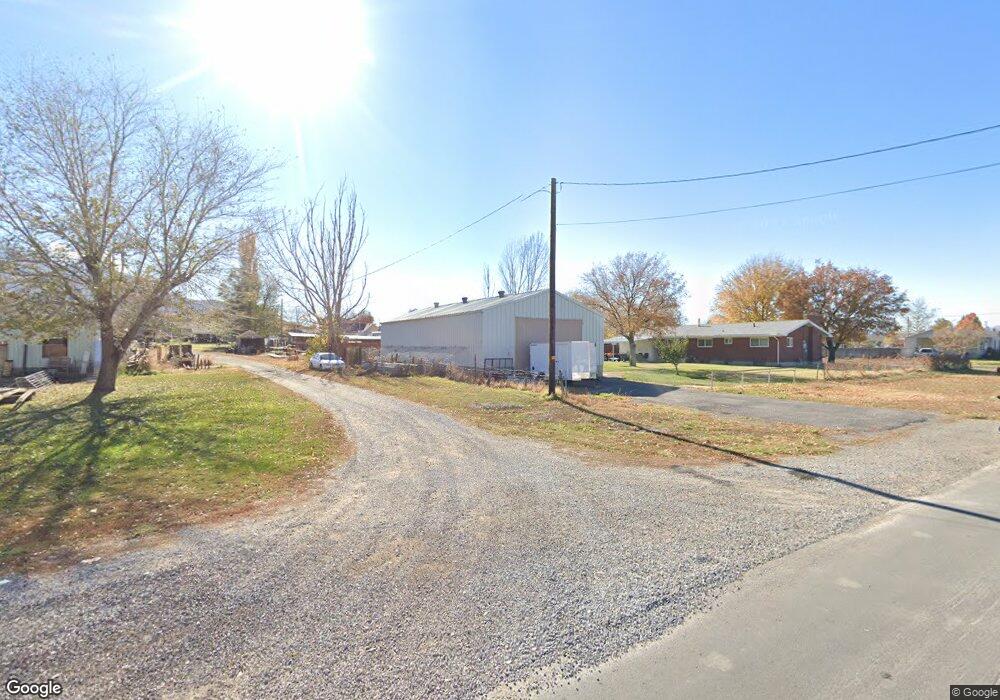
390 N 100 W Santaquin, UT 84655
Estimated Value: $458,000 - $524,466
3
Beds
2
Baths
1,134
Sq Ft
$431/Sq Ft
Est. Value
About This Home
This home is located at 390 N 100 W, Santaquin, UT 84655 and is currently estimated at $489,117, approximately $431 per square foot. 390 N 100 W is a home located in Utah County with nearby schools including Apple Valley Elementary, Payson Junior High School, and Payson High School.
Ownership History
Date
Name
Owned For
Owner Type
Purchase Details
Closed on
Sep 14, 2022
Sold by
Kenison Ted W
Bought by
Kenison Ted W
Current Estimated Value
Purchase Details
Closed on
Apr 30, 2018
Sold by
Tuckett Joyce A and The Tuckett Family Trust
Bought by
Kenison Ted W and Kenison Linda
Home Financials for this Owner
Home Financials are based on the most recent Mortgage that was taken out on this home.
Original Mortgage
$150,000
Interest Rate
4.44%
Mortgage Type
New Conventional
Create a Home Valuation Report for This Property
The Home Valuation Report is an in-depth analysis detailing your home's value as well as a comparison with similar homes in the area
Home Values in the Area
Average Home Value in this Area
Purchase History
| Date | Buyer | Sale Price | Title Company |
|---|---|---|---|
| Kenison Ted W | -- | -- | |
| Kenison Ted W | -- | Pro Title & Escrow Inc |
Source: Public Records
Mortgage History
| Date | Status | Borrower | Loan Amount |
|---|---|---|---|
| Previous Owner | Kenison Ted W | $150,000 |
Source: Public Records
Tax History Compared to Growth
Tax History
| Year | Tax Paid | Tax Assessment Tax Assessment Total Assessment is a certain percentage of the fair market value that is determined by local assessors to be the total taxable value of land and additions on the property. | Land | Improvement |
|---|---|---|---|---|
| 2025 | $2,236 | $258,225 | $153,900 | $315,600 |
| 2024 | $2,236 | $222,695 | $0 | $0 |
| 2023 | $2,227 | $222,475 | $0 | $0 |
| 2022 | $2,309 | $237,930 | $0 | $0 |
| 2021 | $1,961 | $313,200 | $86,800 | $226,400 |
| 2020 | $1,874 | $290,100 | $75,500 | $214,600 |
| 2019 | $1,722 | $272,500 | $71,300 | $201,200 |
| 2018 | $1,647 | $248,600 | $67,100 | $181,500 |
| 2017 | $1,562 | $125,950 | $0 | $0 |
| 2016 | $1,477 | $116,710 | $0 | $0 |
| 2015 | -- | $104,225 | $0 | $0 |
| 2014 | $1,284 | $99,275 | $0 | $0 |
Source: Public Records
Map
Nearby Homes
- 600 N Center St
- 921 N 160 E
- 921 N 160 E Unit 12
- 931 N 160 E Unit 11
- 922 N 160 E Unit 20
- 932 N 160 E Unit 21
- 162 W 690 N
- 348 N 200 E
- 41 W 770 N
- 369 N 500 W Unit 3
- 1700 Farmhouse Plan at Tanner Flats
- 2400 Farmhouse Plan at Tanner Flats
- 923 N 200 E
- 933 N 200 E
- 933 N 200 E Unit 32
- 43 N 300 W
- 153 E Main St Unit B
- 49 S 100 E
- 116 E 840 N
- Pendleton Plan at Silver Oaks