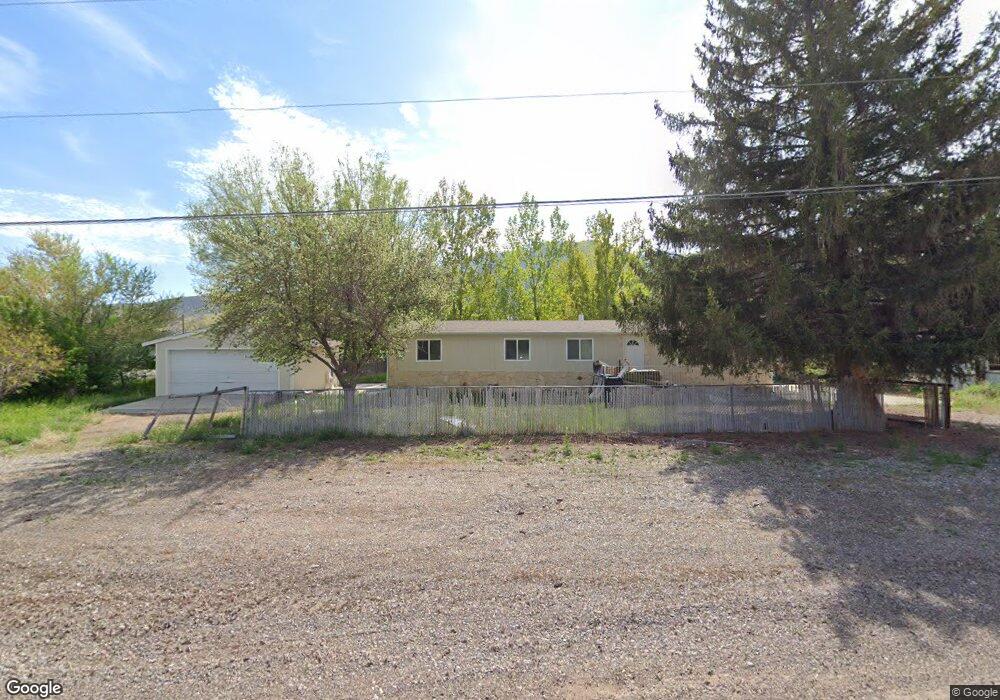
390 N 200 E Monroe, UT 84754
Monroe NeighborhoodEstimated Value: $243,000 - $258,129
3
Beds
2
Baths
1,792
Sq Ft
$140/Sq Ft
Est. Value
About This Home
This home is located at 390 N 200 E, Monroe, UT 84754 and is currently estimated at $251,710, approximately $140 per square foot. 390 N 200 E is a home located in Sevier County with nearby schools including Monroe School, South Sevier Middle School, and South Sevier High School.
Ownership History
Date
Name
Owned For
Owner Type
Purchase Details
Closed on
Oct 22, 2024
Sold by
Tiffany Lancaster Real Estate Inc
Bought by
Burlison Keith and Burlison Gayle
Current Estimated Value
Purchase Details
Closed on
May 18, 2022
Sold by
Ben Salas
Bought by
Tffany Lancaster Real Estate Inc
Purchase Details
Closed on
Oct 7, 2016
Sold by
Jesus Elvira Serrano De
Bought by
Salas Ben
Create a Home Valuation Report for This Property
The Home Valuation Report is an in-depth analysis detailing your home's value as well as a comparison with similar homes in the area
Home Values in the Area
Average Home Value in this Area
Purchase History
| Date | Buyer | Sale Price | Title Company |
|---|---|---|---|
| Burlison Keith | -- | Pinnacle Title | |
| Tffany Lancaster Real Estate Inc | -- | None Listed On Document | |
| Salas Ben | -- | None Available |
Source: Public Records
Tax History
| Year | Tax Paid | Tax Assessment Tax Assessment Total Assessment is a certain percentage of the fair market value that is determined by local assessors to be the total taxable value of land and additions on the property. | Land | Improvement |
|---|---|---|---|---|
| 2025 | $1,077 | $119,606 | $33,711 | $85,895 |
| 2024 | $1,077 | $220,816 | $55,517 | $165,299 |
| 2023 | $2,092 | $223,922 | $57,436 | $166,486 |
| 2022 | $863 | $81,791 | $24,939 | $56,852 |
| 2021 | $348 | $54,608 | $16,332 | $38,276 |
| 2020 | $330 | $48,567 | $15,554 | $33,013 |
| 2019 | $301 | $46,490 | $14,000 | $32,490 |
| 2018 | $304 | $41,770 | $12,440 | $29,330 |
| 2017 | $287 | $40,960 | $13,380 | $27,580 |
| 2016 | $410 | $38,940 | $0 | $0 |
| 2015 | $410 | $38,940 | $0 | $0 |
| 2014 | $410 | $38,940 | $0 | $0 |
Source: Public Records
Map
Nearby Homes
Your Personal Tour Guide
Ask me questions while you tour the home.