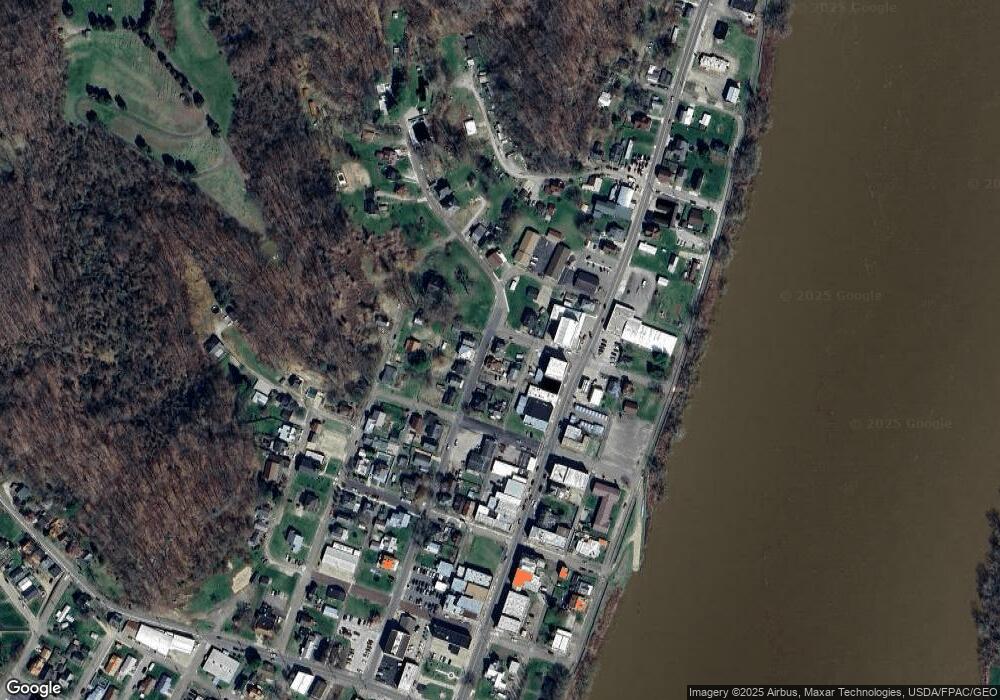
390 N 3rd Ave Middleport, OH 45760
Estimated Value: $78,000 - $105,136
--
Bed
1
Bath
1,704
Sq Ft
$54/Sq Ft
Est. Value
About This Home
This home is located at 390 N 3rd Ave, Middleport, OH 45760 and is currently estimated at $92,534, approximately $54 per square foot. 390 N 3rd Ave is a home located in Meigs County with nearby schools including Meigs Primary School, Meigs Intermediate School, and Meigs Middle School.
Ownership History
Date
Name
Owned For
Owner Type
Purchase Details
Closed on
Jun 11, 2021
Sold by
Barcus John and Barcus Christie
Bought by
Barcus John and Barcus Donna Stackhouse
Current Estimated Value
Home Financials for this Owner
Home Financials are based on the most recent Mortgage that was taken out on this home.
Original Mortgage
$77,200
Outstanding Balance
$58,615
Interest Rate
2.9%
Mortgage Type
New Conventional
Estimated Equity
$33,919
Purchase Details
Closed on
Jun 27, 2005
Sold by
Rayburn Sandra A
Bought by
Barcus John and Barcus Christie
Home Financials for this Owner
Home Financials are based on the most recent Mortgage that was taken out on this home.
Original Mortgage
$98,000
Interest Rate
5.86%
Mortgage Type
Stand Alone First
Purchase Details
Closed on
Aug 12, 1998
Bought by
Barcus John Barcus Christie
Create a Home Valuation Report for This Property
The Home Valuation Report is an in-depth analysis detailing your home's value as well as a comparison with similar homes in the area
Home Values in the Area
Average Home Value in this Area
Purchase History
| Date | Buyer | Sale Price | Title Company |
|---|---|---|---|
| Barcus John | -- | Inspire Closing Services Llc | |
| Barcus John | -- | -- | |
| Barcus John Barcus Christie | $72,700 | -- |
Source: Public Records
Mortgage History
| Date | Status | Borrower | Loan Amount |
|---|---|---|---|
| Open | Barcus John | $77,200 | |
| Closed | Barcus John | $98,000 |
Source: Public Records
Tax History Compared to Growth
Tax History
| Year | Tax Paid | Tax Assessment Tax Assessment Total Assessment is a certain percentage of the fair market value that is determined by local assessors to be the total taxable value of land and additions on the property. | Land | Improvement |
|---|---|---|---|---|
| 2024 | $864 | $21,790 | $4,460 | $17,330 |
| 2023 | $864 | $21,790 | $4,460 | $17,330 |
| 2022 | $837 | $21,790 | $4,460 | $17,330 |
| 2021 | $884 | $20,070 | $4,240 | $15,830 |
| 2020 | $890 | $20,070 | $4,240 | $15,830 |
| 2019 | $880 | $20,070 | $4,240 | $15,830 |
| 2018 | $780 | $18,210 | $2,840 | $15,370 |
| 2017 | $780 | $18,210 | $2,840 | $15,370 |
| 2016 | $791 | $18,210 | $2,840 | $15,370 |
| 2014 | $948 | $23,860 | $2,560 | $21,300 |
| 2013 | $948 | $23,860 | $2,560 | $21,300 |
Source: Public Records
Map
Nearby Homes