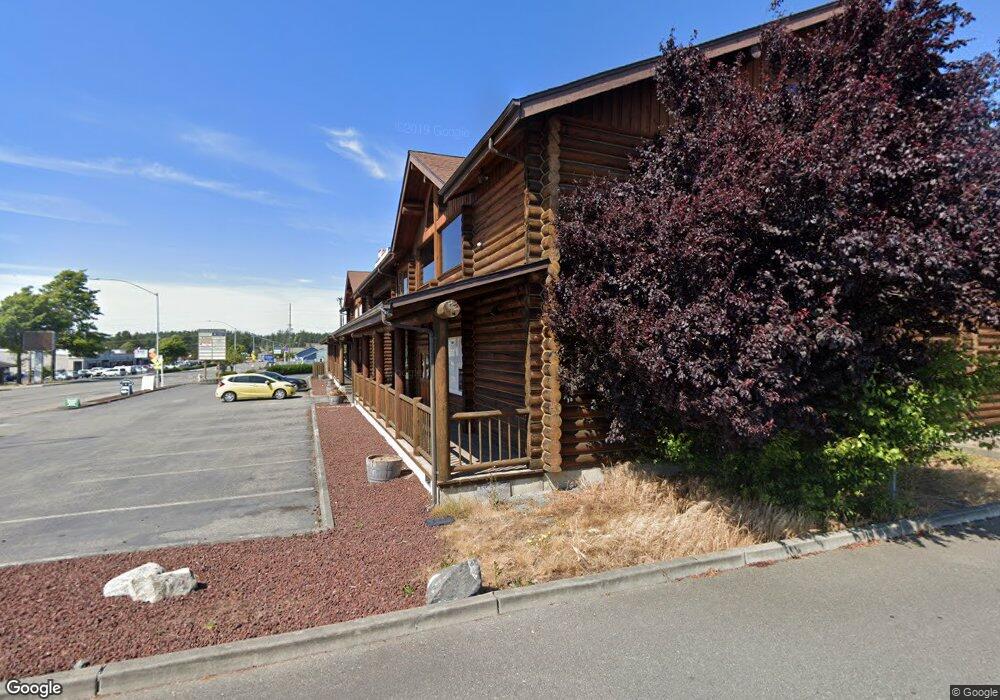
390 NE Midway Blvd Unit B107 Oak Harbor, WA 98277
--
Bed
--
Bath
1,950
Sq Ft
4,051
Sq Ft Lot
About This Home
This home is located at 390 NE Midway Blvd Unit B107, Oak Harbor, WA 98277. 390 NE Midway Blvd Unit B107 is a home located in Island County with nearby schools including Oak Harbor Elementary School, North Whidbey Middle School, and Oak Harbor High School.
Ownership History
Date
Name
Owned For
Owner Type
Purchase Details
Closed on
Feb 9, 2023
Sold by
390 Ne Midway Llc
Bought by
Valkyrie 1997 Llc
Home Financials for this Owner
Home Financials are based on the most recent Mortgage that was taken out on this home.
Original Mortgage
$100,000
Outstanding Balance
$79,167
Interest Rate
6.33%
Mortgage Type
Seller Take Back
Purchase Details
Closed on
May 24, 2022
Sold by
Business Bank Of Skagit County
Bought by
390 Ne Midway Llc
Purchase Details
Closed on
Nov 17, 2010
Sold by
Cielo Land Stewardship Llc
Bought by
Business Bank Of Skagit County
Purchase Details
Closed on
Jun 1, 2007
Sold by
Midway Traders Village Llc
Bought by
Cielo Land Stewardship Llc
Home Financials for this Owner
Home Financials are based on the most recent Mortgage that was taken out on this home.
Original Mortgage
$340,000
Interest Rate
6.14%
Mortgage Type
Commercial
Create a Home Valuation Report for This Property
The Home Valuation Report is an in-depth analysis detailing your home's value as well as a comparison with similar homes in the area
Home Values in the Area
Average Home Value in this Area
Purchase History
| Date | Buyer | Sale Price | Title Company |
|---|---|---|---|
| Valkyrie 1997 Llc | -- | -- | |
| 390 Ne Midway Llc | -- | None Listed On Document | |
| Business Bank Of Skagit County | -- | None Available | |
| Cielo Land Stewardship Llc | $420,000 | Chicago Title Co Island Div |
Source: Public Records
Mortgage History
| Date | Status | Borrower | Loan Amount |
|---|---|---|---|
| Open | Valkyrie 1997 Llc | $100,000 | |
| Previous Owner | Cielo Land Stewardship Llc | $340,000 |
Source: Public Records
Tax History Compared to Growth
Tax History
| Year | Tax Paid | Tax Assessment Tax Assessment Total Assessment is a certain percentage of the fair market value that is determined by local assessors to be the total taxable value of land and additions on the property. | Land | Improvement |
|---|---|---|---|---|
| 2025 | $852 | $90,188 | $5,000 | $85,188 |
| 2024 | $903 | $100,006 | $5,000 | $95,006 |
| 2023 | $903 | $106,551 | $5,000 | $101,551 |
| 2022 | $849 | $88,197 | $5,000 | $83,197 |
| 2021 | $841 | $78,852 | $5,000 | $73,852 |
| 2020 | $1,052 | $77,798 | $5,000 | $72,798 |
| 2019 | $1,301 | $96,491 | $6,880 | $89,611 |
| 2018 | $1,479 | $129,663 | $70,516 | $59,147 |
| 2017 | $1,225 | $130,050 | $70,516 | $59,534 |
| 2016 | $1,280 | $114,551 | $70,516 | $44,035 |
| 2015 | $1,313 | $115,155 | $70,516 | $44,639 |
| 2013 | -- | $201,508 | $70,516 | $130,992 |
Source: Public Records
Map
Nearby Homes
- 187 NE Nunan Loop Unit 2
- 381 NE Queets St
- 1662 NE 5th Ave
- 726 E Whidbey Ave
- 0 XX SE Neil St
- 39974 State Route 20
- 225 NE Ernst St Unit Spc 30
- 225 NE Ernst St Unit 61
- 545 SE O'Leary St
- 544 Easy St
- 1864 NE 11th Ave
- 427 SE Ely St
- 583 SE 6th Ave
- 110 N Oak Harbor St
- 0 XXX NE 16th Ave
- 1475 SE 9th Ave Unit All
- 1320 N Oak Harbor St Unit 162
- 1320 N Oak Harbor St Unit 1
- 1214 NE Big Berry Loop
- 690 NW Atalanta Way Unit C102
- 390 NE Midway Blvd Unit B104
- 390 NE Midway Blvd Unit B202
- 390 NE Midway Blvd Unit B206
- 390 NE Midway Blvd Unit B104A
- 390 NE Midway Blvd Unit A202
- 390 NE Midway Blvd Unit A203
- 390 NE Midway Blvd Unit A101
- 390 NE Midway Blvd Unit B204
- 390 NE Midway Blvd Unit B205
- 390 NE Midway Blvd
- 390 NE Midway Blvd Unit B102
- 390 NE Midway Blvd Unit B106
- 390 NE Midway Blvd Unit B105
- 390 NE Midway Blvd Unit B101
- 390 NE Midway Blvd Unit A103
- 390 NE Midway Blvd Unit A105
- 390 NE Midway Blvd Unit B103
- 390 NE Midway Blvd Unit 61/62
- 1416 SE Midway Blvd
- 1416 SE Midway Blvd Unit 5B