390 Newton St Hoffman Estates, IL 60169
South Hoffman Estates NeighborhoodEstimated Value: $352,881 - $486,000
3
Beds
1
Bath
1,296
Sq Ft
$307/Sq Ft
Est. Value
About This Home
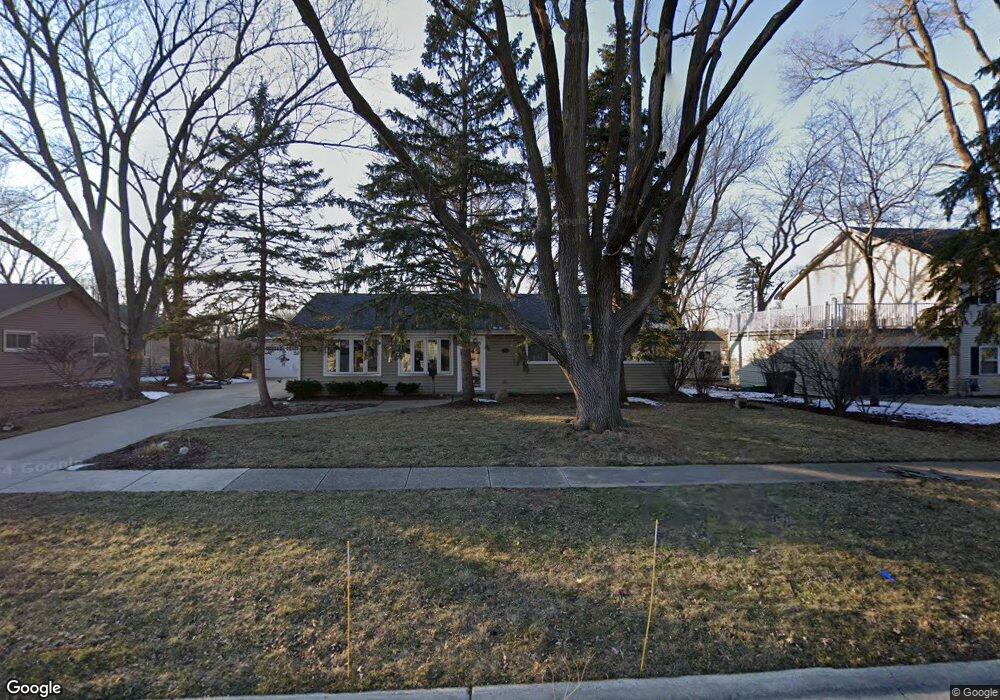
This home is located at 390 Newton St, Hoffman Estates, IL 60169 and is currently estimated at $397,720, approximately $306 per square foot. 390 Newton St is a home located in Cook County with nearby schools including Lakeview Elementary School, Helen Keller Junior High School, and Schaumburg High School.
Ownership History
Date
Name
Owned For
Owner Type
Purchase Details
Closed on
May 13, 2005
Sold by
Majchrowski Ryan J and Majchrowski Stacy M
Bought by
Nelson David A and Nelson Amy E
Current Estimated Value
Home Financials for this Owner
Home Financials are based on the most recent Mortgage that was taken out on this home.
Original Mortgage
$234,400
Outstanding Balance
$122,767
Interest Rate
5.91%
Mortgage Type
Fannie Mae Freddie Mac
Estimated Equity
$274,953
Purchase Details
Closed on
Oct 19, 2000
Sold by
Majchrowski Ryan J
Bought by
Majchrowski Ryan J and Majchrowski Stacy M
Purchase Details
Closed on
Apr 29, 1998
Sold by
Harris Bank Palatine
Bought by
Majchowski Ryan J
Home Financials for this Owner
Home Financials are based on the most recent Mortgage that was taken out on this home.
Original Mortgage
$135,000
Interest Rate
7.2%
Create a Home Valuation Report for This Property
The Home Valuation Report is an in-depth analysis detailing your home's value as well as a comparison with similar homes in the area
Home Values in the Area
Average Home Value in this Area
Purchase History
| Date | Buyer | Sale Price | Title Company |
|---|---|---|---|
| Nelson David A | $293,000 | Atg Search | |
| Majchrowski Ryan J | -- | Chicago Title Insurance Co | |
| Majchowski Ryan J | $146,000 | -- |
Source: Public Records
Mortgage History
| Date | Status | Borrower | Loan Amount |
|---|---|---|---|
| Open | Nelson David A | $234,400 | |
| Previous Owner | Majchowski Ryan J | $135,000 | |
| Closed | Nelson David A | $43,950 |
Source: Public Records
Tax History Compared to Growth
Tax History
| Year | Tax Paid | Tax Assessment Tax Assessment Total Assessment is a certain percentage of the fair market value that is determined by local assessors to be the total taxable value of land and additions on the property. | Land | Improvement |
|---|---|---|---|---|
| 2024 | $6,444 | $24,313 | $6,117 | $18,196 |
| 2023 | $6,205 | $24,313 | $6,117 | $18,196 |
| 2022 | $6,205 | $24,313 | $6,117 | $18,196 |
| 2021 | $5,938 | $21,053 | $4,332 | $16,721 |
| 2020 | $5,874 | $21,053 | $4,332 | $16,721 |
| 2019 | $5,922 | $23,656 | $4,332 | $19,324 |
| 2018 | $5,041 | $18,894 | $3,823 | $15,071 |
| 2017 | $4,970 | $18,894 | $3,823 | $15,071 |
| 2016 | $4,885 | $18,894 | $3,823 | $15,071 |
| 2015 | $4,765 | $17,460 | $3,313 | $14,147 |
| 2014 | $4,698 | $17,460 | $3,313 | $14,147 |
| 2013 | $4,560 | $17,460 | $3,313 | $14,147 |
Source: Public Records
Map
Nearby Homes
- 455 Mohave St
- 480 Illinois Blvd
- 313 Lincoln St
- 510 Milan Ln
- 585 Newark Ln
- 320 Pleasant St
- 645 Maywood Ln
- 365 Washington Blvd
- 100 Des Plaines Ln
- 21 White Pine Dr
- 370 Flagstaff Ln
- 153 Fulbright Ln
- 147 Fulbright Ln
- 565 Flagstaff Ln
- 13 Sarahs Grove Ln
- 32 Hilltop Dr
- 11 Stone Bridge Ct
- 12 Stone Bridge Ct
- 221 Grissom Ln
- 700 Cumberland St