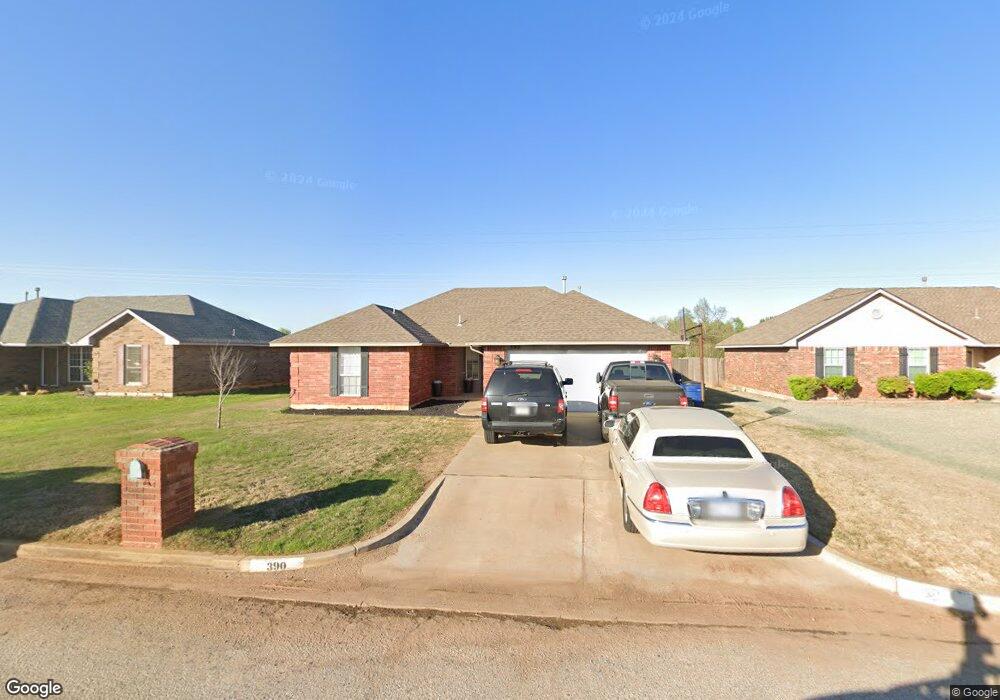
390 Timberidge Rd Harrah, OK 73045
Estimated Value: $211,000 - $220,000
3
Beds
2
Baths
1,248
Sq Ft
$172/Sq Ft
Est. Value
About This Home
This home is located at 390 Timberidge Rd, Harrah, OK 73045 and is currently estimated at $214,380, approximately $171 per square foot. 390 Timberidge Rd is a home located in Oklahoma County with nearby schools including Virginia Smith Elementary School, Clara Reynolds Elementary School, and Russell Babb Elementary School.
Ownership History
Date
Name
Owned For
Owner Type
Purchase Details
Closed on
Jul 29, 2019
Sold by
Harris Mark R and Lumley Patricia L
Bought by
Mark Raymond Harris and Mark Patricia Lyn
Current Estimated Value
Purchase Details
Closed on
Aug 8, 2006
Sold by
Vangurp Christopher Lawrence
Bought by
Harris Mark R and Lumley Patricia L
Home Financials for this Owner
Home Financials are based on the most recent Mortgage that was taken out on this home.
Original Mortgage
$74,500
Outstanding Balance
$44,704
Interest Rate
6.75%
Mortgage Type
New Conventional
Estimated Equity
$169,676
Purchase Details
Closed on
Aug 31, 2004
Sold by
Scott Smith Custom Homes Inc
Bought by
Vangurp Christopher Lawrence
Purchase Details
Closed on
Dec 4, 2003
Sold by
North Star Llc
Bought by
Scott Smith Custom Homes Inc
Create a Home Valuation Report for This Property
The Home Valuation Report is an in-depth analysis detailing your home's value as well as a comparison with similar homes in the area
Home Values in the Area
Average Home Value in this Area
Purchase History
| Date | Buyer | Sale Price | Title Company |
|---|---|---|---|
| Mark Raymond Harris | -- | None Available | |
| Harris Mark R | $108,748 | Capitol Abstract & Title | |
| Vangurp Christopher Lawrence | $98,500 | Capitol Abstract & Title | |
| Scott Smith Custom Homes Inc | $165,000 | First American Title & Tr Co | |
| North Star Llc | -- | First American Title & Tr Co |
Source: Public Records
Mortgage History
| Date | Status | Borrower | Loan Amount |
|---|---|---|---|
| Open | Harris Mark R | $74,500 |
Source: Public Records
Tax History Compared to Growth
Tax History
| Year | Tax Paid | Tax Assessment Tax Assessment Total Assessment is a certain percentage of the fair market value that is determined by local assessors to be the total taxable value of land and additions on the property. | Land | Improvement |
|---|---|---|---|---|
| 2024 | $1,726 | $18,517 | $2,955 | $15,562 |
| 2023 | $1,726 | $17,635 | $2,954 | $14,681 |
| 2022 | $1,671 | $16,795 | $3,283 | $13,512 |
| 2021 | $1,592 | $15,996 | $3,205 | $12,791 |
| 2020 | $1,557 | $15,235 | $3,272 | $11,963 |
| 2019 | $1,510 | $14,795 | $3,272 | $11,523 |
| 2018 | $1,486 | $14,301 | $0 | $0 |
| 2017 | $1,445 | $14,189 | $2,879 | $11,310 |
| 2016 | $1,431 | $13,799 | $2,878 | $10,921 |
| 2015 | $1,350 | $13,142 | $2,879 | $10,263 |
| 2014 | $1,316 | $12,841 | $2,879 | $9,962 |
Source: Public Records
Map
Nearby Homes
- 410 Harvest Hills
- 435 Crooked Oak Dr
- 20160 Park Ln
- 20111 Park Ln
- 318 Park Ln
- 20110 Park Ln
- 279 Woodlands Dr
- 253 Park Ln
- 315 Woodrock St
- 383 Pleasant View
- 465 Echo Ln
- 20080 Woodrock St
- 20061 Woodrock St
- 154 Woodlands Dr
- 20435 Palmer Rd
- 20101 Park Ln
- 160 Hickory Stick Ln
- 290 Hickory Stick Ln
- 364 Rock Hollow Rd
- 319 Rock Hollow Rd
- 406 Timberidge Rd
- 374 Timberidge Rd
- 358 Timberidge Rd
- 434 Timberidge Rd
- 371 Harvest Hills
- 355 Harvest Hills
- 442 Timberidge Rd
- 342 Timberidge Rd
- 339 Harvest Hills
- 387 Timberidge Rd
- 403 Timberidge Rd
- 371 Timberidge Rd
- 403 Harvest Hills
- 431 Timberidge Rd
- 323 Harvest Hills
- 355 Timberidge Rd
- 20180 Roman Rd
- 456 Timberidge Rd
- 326 Timberidge Rd
- 419 Harvest Hills