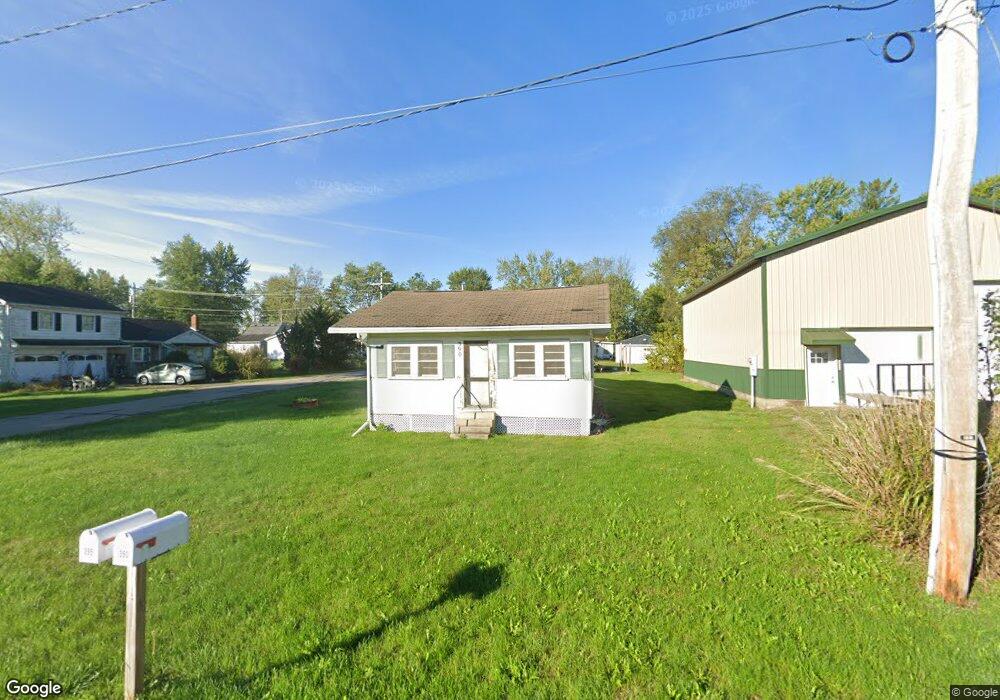
390 Union St Lakeview, OH 43331
Estimated Value: $99,000 - $140,000
1
Bed
1
Bath
704
Sq Ft
$159/Sq Ft
Est. Value
About This Home
This home is located at 390 Union St, Lakeview, OH 43331 and is currently estimated at $111,706, approximately $158 per square foot. 390 Union St is a home located in Logan County with nearby schools including Indian Lake Elementary School, Indian Lake Middle School, and Indian Lake High School.
Ownership History
Date
Name
Owned For
Owner Type
Purchase Details
Closed on
Dec 27, 2024
Sold by
Mansion Minders Llc
Bought by
Bbt Investments Llc
Current Estimated Value
Purchase Details
Closed on
Jun 20, 2017
Sold by
Mansion Minders Llc
Bought by
Feller Ron
Home Financials for this Owner
Home Financials are based on the most recent Mortgage that was taken out on this home.
Original Mortgage
$50,000
Interest Rate
7%
Mortgage Type
Land Contract Argmt. Of Sale
Purchase Details
Closed on
Jun 29, 2016
Sold by
Pulfer Thomas W and Jenkins Greg A
Bought by
Mansion Minders Llc
Purchase Details
Closed on
Sep 8, 2006
Bought by
Pulfer Thomas W
Purchase Details
Closed on
Jun 16, 1999
Bought by
Sawmiller Gary
Create a Home Valuation Report for This Property
The Home Valuation Report is an in-depth analysis detailing your home's value as well as a comparison with similar homes in the area
Home Values in the Area
Average Home Value in this Area
Purchase History
| Date | Buyer | Sale Price | Title Company |
|---|---|---|---|
| Bbt Investments Llc | -- | None Listed On Document | |
| Bbt Investments Llc | -- | None Listed On Document | |
| Bbt Investments Llc | -- | None Listed On Document | |
| Feller Ron | $50,000 | None Available | |
| Mansion Minders Llc | -- | None Available | |
| Pulfer Thomas W | $36,700 | -- | |
| Sawmiller Gary | $38,000 | -- |
Source: Public Records
Mortgage History
| Date | Status | Borrower | Loan Amount |
|---|---|---|---|
| Previous Owner | Feller Ron | $50,000 |
Source: Public Records
Tax History Compared to Growth
Tax History
| Year | Tax Paid | Tax Assessment Tax Assessment Total Assessment is a certain percentage of the fair market value that is determined by local assessors to be the total taxable value of land and additions on the property. | Land | Improvement |
|---|---|---|---|---|
| 2024 | $840 | $21,670 | $5,830 | $15,840 |
| 2023 | $840 | $21,670 | $5,830 | $15,840 |
| 2022 | $894 | $18,060 | $4,860 | $13,200 |
| 2021 | $833 | $18,060 | $4,860 | $13,200 |
| 2020 | $834 | $14,130 | $3,020 | $11,110 |
| 2019 | $841 | $14,130 | $3,020 | $11,110 |
| 2018 | $671 | $14,130 | $3,020 | $11,110 |
| 2016 | $600 | $12,280 | $2,620 | $9,660 |
| 2014 | $531 | $12,280 | $2,620 | $9,660 |
| 2013 | $503 | $12,280 | $2,620 | $9,660 |
| 2012 | $630 | $15,050 | $2,240 | $12,810 |
Source: Public Records
Map
Nearby Homes