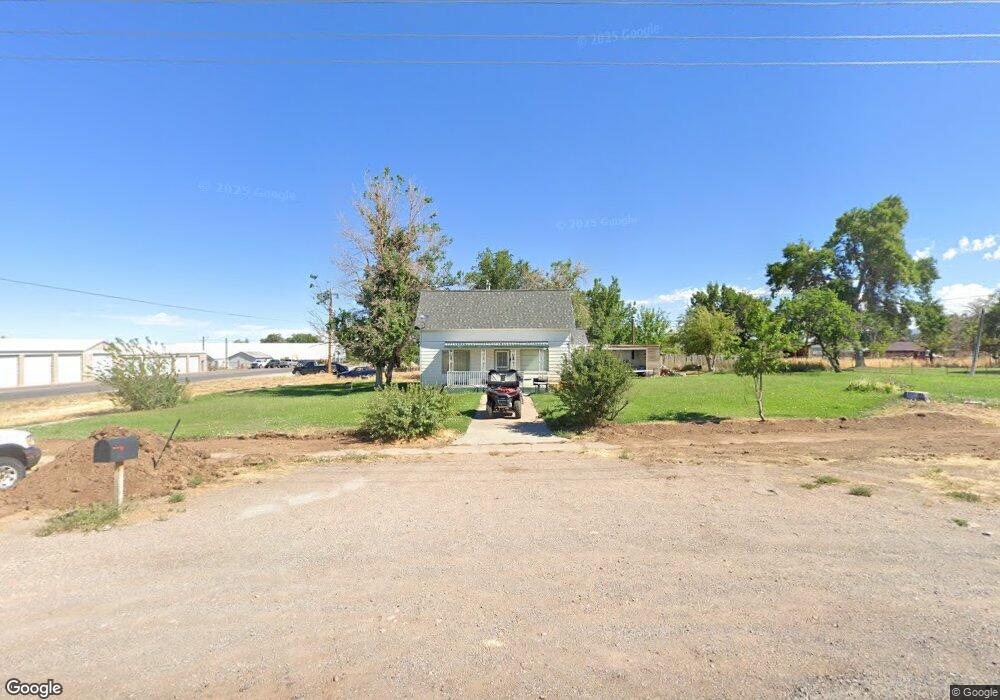
390 W 100 N Fillmore, UT 84631
Estimated Value: $246,000 - $319,000
4
Beds
2
Baths
1,452
Sq Ft
$194/Sq Ft
Est. Value
About This Home
This home is located at 390 W 100 N, Fillmore, UT 84631 and is currently estimated at $282,156, approximately $194 per square foot. 390 W 100 N is a home located in Millard County.
Ownership History
Date
Name
Owned For
Owner Type
Purchase Details
Closed on
Nov 14, 2022
Sold by
Rubio Eric
Bought by
Rubio Anna
Current Estimated Value
Purchase Details
Closed on
Aug 2, 2013
Sold by
Barry Norman Leon and Barry Cecil Leroy
Bought by
Rubio Eric and Rubio Anna
Home Financials for this Owner
Home Financials are based on the most recent Mortgage that was taken out on this home.
Original Mortgage
$60,500
Interest Rate
4.28%
Create a Home Valuation Report for This Property
The Home Valuation Report is an in-depth analysis detailing your home's value as well as a comparison with similar homes in the area
Home Values in the Area
Average Home Value in this Area
Purchase History
| Date | Buyer | Sale Price | Title Company |
|---|---|---|---|
| Rubio Anna | -- | -- | |
| Rubio Eric | -- | -- |
Source: Public Records
Mortgage History
| Date | Status | Borrower | Loan Amount |
|---|---|---|---|
| Previous Owner | Rubio Eric | $60,500 |
Source: Public Records
Tax History Compared to Growth
Tax History
| Year | Tax Paid | Tax Assessment Tax Assessment Total Assessment is a certain percentage of the fair market value that is determined by local assessors to be the total taxable value of land and additions on the property. | Land | Improvement |
|---|---|---|---|---|
| 2024 | $1,074 | $101,229 | $20,523 | $80,706 |
| 2023 | $1,129 | $101,229 | $20,523 | $80,706 |
| 2022 | $877 | $78,749 | $18,657 | $60,092 |
| 2021 | $755 | $65,054 | $12,115 | $52,939 |
| 2020 | $698 | $60,518 | $11,014 | $49,504 |
| 2019 | $601 | $52,238 | $11,014 | $41,224 |
| 2018 | $574 | $51,075 | $11,014 | $40,061 |
| 2017 | $517 | $43,746 | $10,890 | $32,856 |
| 2016 | $494 | $43,746 | $10,890 | $32,856 |
| 2015 | $495 | $43,746 | $10,890 | $32,856 |
| 2014 | -- | $43,746 | $10,890 | $32,856 |
| 2013 | -- | $41,207 | $10,890 | $30,317 |
Source: Public Records
Map
Nearby Homes
- 225 W 200 St N
- 335 W 400 North St
- 60 W 100 N
- 380 N 200 St W
- 2600 S 400 Rd W
- 390 N 100 W
- 410 W 400 N
- 40 S 100 Rd E
- 190 W 400 St S
- 30 E 300 S
- 625 N 100 St E Unit 20
- 220 S 200 E
- 155 E 500 St S
- 430 E Canyon Rd
- 405 E 500 St S
- 310 S 600 E
- 2155 N Cedar Mountain Rd
- 760 E 700 St S
- 1100 S 725 Rd W
- 690 E 500 S