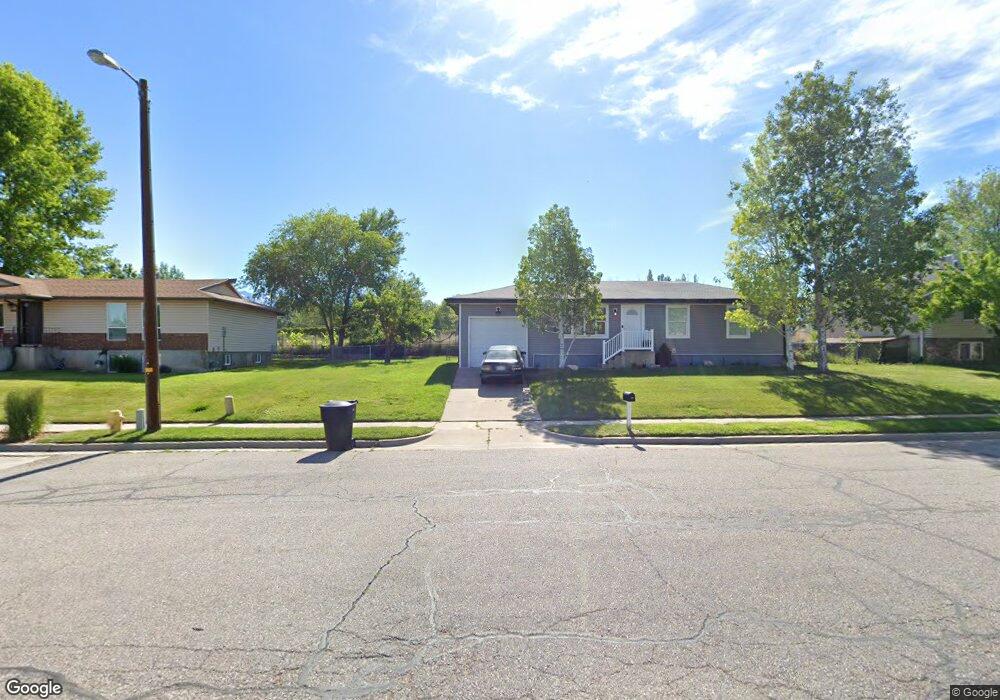
390 W 1950 N Clearfield, UT 84015
Estimated Value: $396,000 - $410,821
4
Beds
3
Baths
2,350
Sq Ft
$172/Sq Ft
Est. Value
About This Home
This home is located at 390 W 1950 N, Clearfield, UT 84015 and is currently estimated at $403,705, approximately $171 per square foot. 390 W 1950 N is a home located in Davis County with nearby schools including Sunset School, Sunset Junior High School, and Northridge High School.
Ownership History
Date
Name
Owned For
Owner Type
Purchase Details
Closed on
Nov 24, 2021
Sold by
Mckenzie Allen W
Bought by
Mckenzie Allen W and The Allen W Mckenzie Family Tr
Current Estimated Value
Purchase Details
Closed on
Jun 25, 1997
Sold by
Mckenzie Allen W and Mckenzie Cynthia
Bought by
Mckenzie Allen W
Home Financials for this Owner
Home Financials are based on the most recent Mortgage that was taken out on this home.
Original Mortgage
$100,800
Interest Rate
7.91%
Mortgage Type
Balloon
Purchase Details
Closed on
May 30, 1996
Sold by
Galbraith Dennis Scott and Galbraith Lorraine R
Bought by
Mckenzie Allen W and Mckenzie Cynthia
Home Financials for this Owner
Home Financials are based on the most recent Mortgage that was taken out on this home.
Original Mortgage
$98,450
Interest Rate
7.97%
Create a Home Valuation Report for This Property
The Home Valuation Report is an in-depth analysis detailing your home's value as well as a comparison with similar homes in the area
Home Values in the Area
Average Home Value in this Area
Purchase History
| Date | Buyer | Sale Price | Title Company |
|---|---|---|---|
| Mckenzie Allen W | -- | None Available | |
| Mckenzie Allen W | -- | Avis & Archibald Title Insur | |
| Mckenzie Allen W | -- | Mountain View Title |
Source: Public Records
Mortgage History
| Date | Status | Borrower | Loan Amount |
|---|---|---|---|
| Closed | Mckenzie Allen W | $100,800 | |
| Closed | Mckenzie Allen W | $98,450 |
Source: Public Records
Tax History Compared to Growth
Tax History
| Year | Tax Paid | Tax Assessment Tax Assessment Total Assessment is a certain percentage of the fair market value that is determined by local assessors to be the total taxable value of land and additions on the property. | Land | Improvement |
|---|---|---|---|---|
| 2025 | $2,394 | $218,350 | $73,520 | $144,830 |
| 2024 | $2,182 | $199,100 | $70,252 | $128,848 |
| 2023 | $2,038 | $339,000 | $111,929 | $227,071 |
| 2022 | $2,199 | $198,000 | $63,728 | $134,272 |
| 2021 | $1,901 | $269,000 | $70,169 | $198,831 |
| 2020 | $1,667 | $232,000 | $59,488 | $172,512 |
| 2019 | $1,563 | $223,000 | $73,090 | $149,910 |
| 2018 | $1,396 | $195,000 | $58,409 | $136,591 |
| 2016 | $1,179 | $84,645 | $27,629 | $57,016 |
| 2015 | $1,143 | $77,715 | $27,796 | $49,919 |
| 2014 | $1,047 | $72,756 | $27,796 | $44,960 |
| 2013 | -- | $70,377 | $23,265 | $47,112 |
Source: Public Records
Map
Nearby Homes
- 1746 N 475 W
- 1721 N 400 W
- 2177 N 450 W
- 1874 N 200 W
- 1696 N 475 W
- 1623 N 400 W
- 648 W 2200 N
- 1974 N 75 W
- 52 W 2000 N
- 2085 N Main St Unit 409
- 2085 N Main St Unit 108
- 2085 N Main St Unit 401
- 2085 N Main St Unit 308
- 2085 N Main St Unit 116
- 2085 N Main St Unit 201
- 2085 N Main St Unit 402
- 2085 N Main St Unit 202
- 2085 N Main St Unit 301
- 2085 N Main St Unit 302
- 2085 N Main St Unit 115