Estimated Value: $459,000 - $588,000
4
Beds
3
Baths
2,296
Sq Ft
$222/Sq Ft
Est. Value
About This Home
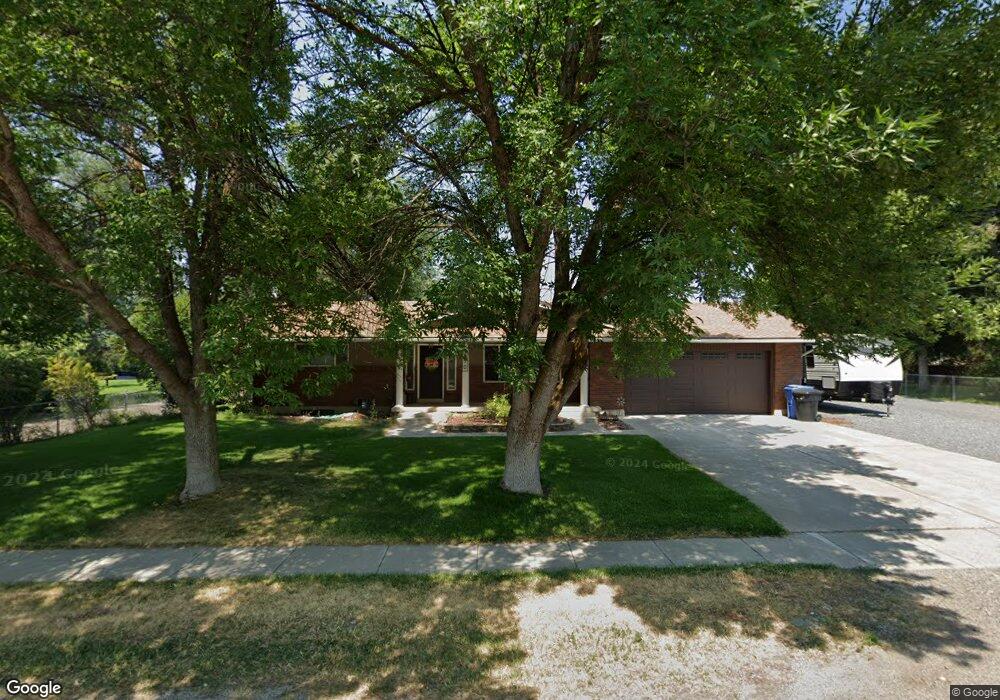
This home is located at 390 W 400 N, Hyrum, UT 84319 and is currently estimated at $508,877, approximately $221 per square foot. 390 W 400 N is a home located in Cache County with nearby schools including Lincoln School, South Cache Middle School, and Mountain Crest High School.
Ownership History
Date
Name
Owned For
Owner Type
Purchase Details
Closed on
Apr 3, 2021
Sold by
Thornley Matthew and Thornley Tessa
Bought by
Thornley Tessa and Thornley Matthew Craig
Current Estimated Value
Home Financials for this Owner
Home Financials are based on the most recent Mortgage that was taken out on this home.
Original Mortgage
$196,000
Outstanding Balance
$144,863
Interest Rate
2.9%
Mortgage Type
New Conventional
Estimated Equity
$364,014
Purchase Details
Closed on
Mar 11, 2013
Sold by
Thornley Matthew and Bodrero Tessa L
Bought by
Thornley Matthew and Bodrero Tessa L
Home Financials for this Owner
Home Financials are based on the most recent Mortgage that was taken out on this home.
Original Mortgage
$219,400
Interest Rate
3.53%
Mortgage Type
New Conventional
Purchase Details
Closed on
May 25, 2010
Sold by
Doss Ronald N
Bought by
Thornley Matthew and Bodrero Tessa L
Home Financials for this Owner
Home Financials are based on the most recent Mortgage that was taken out on this home.
Original Mortgage
$226,943
Interest Rate
5.03%
Mortgage Type
FHA
Purchase Details
Closed on
Apr 26, 2002
Sold by
Kalin Stephen R and Kalin Nancy E
Bought by
Doss Ronald N and Doss Lisa G
Home Financials for this Owner
Home Financials are based on the most recent Mortgage that was taken out on this home.
Original Mortgage
$85,000
Interest Rate
7.08%
Mortgage Type
Purchase Money Mortgage
Create a Home Valuation Report for This Property
The Home Valuation Report is an in-depth analysis detailing your home's value as well as a comparison with similar homes in the area
Home Values in the Area
Average Home Value in this Area
Purchase History
| Date | Buyer | Sale Price | Title Company |
|---|---|---|---|
| Thornley Tessa | -- | Vanguard Title Ins Agcy Llc | |
| Thornley Matthew | -- | Advanced Title | |
| Thornley Matthew | -- | Cache Title Company | |
| Doss Ronald N | -- | Northern Title Company |
Source: Public Records
Mortgage History
| Date | Status | Borrower | Loan Amount |
|---|---|---|---|
| Open | Thornley Tessa | $196,000 | |
| Closed | Thornley Matthew | $219,400 | |
| Closed | Thornley Matthew | $226,943 | |
| Previous Owner | Doss Ronald N | $85,000 |
Source: Public Records
Tax History Compared to Growth
Tax History
| Year | Tax Paid | Tax Assessment Tax Assessment Total Assessment is a certain percentage of the fair market value that is determined by local assessors to be the total taxable value of land and additions on the property. | Land | Improvement |
|---|---|---|---|---|
| 2025 | $1,999 | $287,010 | $0 | $0 |
| 2024 | $214 | $286,310 | $0 | $0 |
| 2023 | $1,829 | $234,510 | $0 | $0 |
| 2022 | $1,894 | $232,640 | $0 | $0 |
| 2021 | $1,867 | $339,180 | $99,360 | $239,820 |
| 2020 | $1,773 | $300,560 | $99,360 | $201,200 |
| 2019 | $1,539 | $249,120 | $91,620 | $157,500 |
| 2018 | $1,297 | $201,814 | $67,120 | $134,694 |
| 2017 | $1,286 | $107,760 | $0 | $0 |
| 2016 | $1,315 | $107,760 | $0 | $0 |
| 2015 | $1,318 | $107,760 | $0 | $0 |
| 2014 | $1,289 | $107,785 | $0 | $0 |
| 2013 | -- | $106,160 | $0 | $0 |
Source: Public Records
Map
Nearby Homes