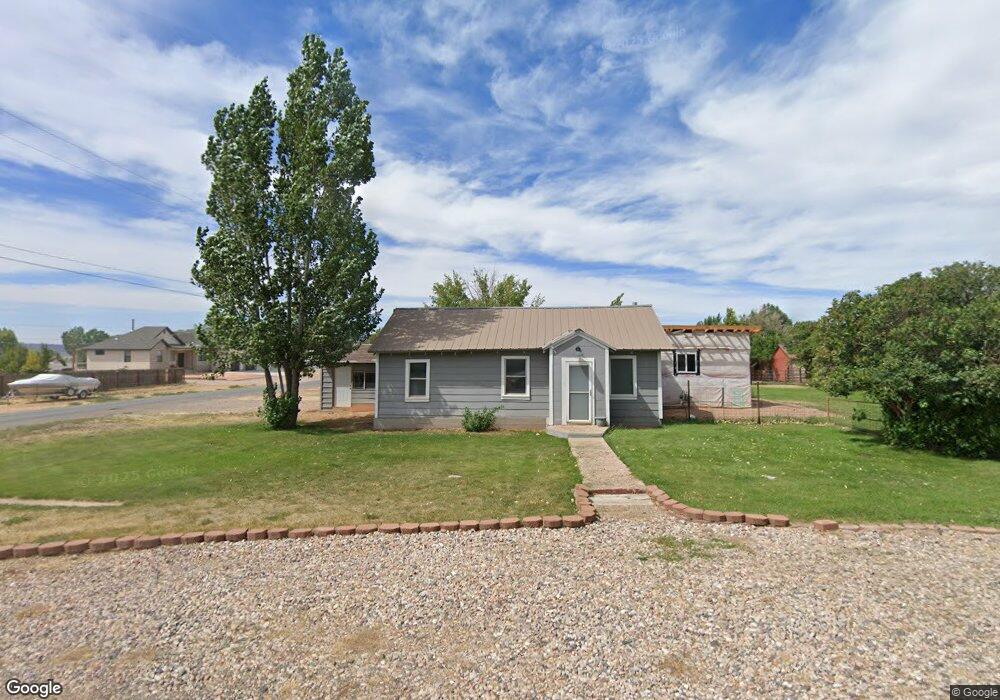
390 W 400 N Parowan, UT 84761
Estimated Value: $302,355 - $465,000
3
Beds
1
Bath
1,893
Sq Ft
$199/Sq Ft
Est. Value
About This Home
This home is located at 390 W 400 N, Parowan, UT 84761 and is currently estimated at $377,118, approximately $199 per square foot. 390 W 400 N is a home located in Iron County with nearby schools including Parowan School, Parowan High School, and Cedar City High School.
Ownership History
Date
Name
Owned For
Owner Type
Purchase Details
Closed on
Sep 20, 2022
Sold by
Louis Clark Michael
Bought by
Clark Family Trust
Current Estimated Value
Purchase Details
Closed on
Jan 14, 2022
Sold by
Jake Bess
Bought by
Topham Tyler R
Home Financials for this Owner
Home Financials are based on the most recent Mortgage that was taken out on this home.
Original Mortgage
$137,750
Interest Rate
3.05%
Mortgage Type
New Conventional
Purchase Details
Closed on
Nov 29, 2010
Sold by
Hulet Leslie J
Bought by
Bess Jake and Bess Shaneal
Home Financials for this Owner
Home Financials are based on the most recent Mortgage that was taken out on this home.
Original Mortgage
$92,227
Interest Rate
4.18%
Mortgage Type
New Conventional
Create a Home Valuation Report for This Property
The Home Valuation Report is an in-depth analysis detailing your home's value as well as a comparison with similar homes in the area
Home Values in the Area
Average Home Value in this Area
Purchase History
| Date | Buyer | Sale Price | Title Company |
|---|---|---|---|
| Clark Family Trust | -- | -- | |
| Topham Tyler R | -- | Southern Utah Title | |
| Bess Jake | -- | Mountain View Title |
Source: Public Records
Mortgage History
| Date | Status | Borrower | Loan Amount |
|---|---|---|---|
| Previous Owner | Topham Tyler R | $137,750 | |
| Previous Owner | Bess Jake | $92,227 |
Source: Public Records
Tax History Compared to Growth
Tax History
| Year | Tax Paid | Tax Assessment Tax Assessment Total Assessment is a certain percentage of the fair market value that is determined by local assessors to be the total taxable value of land and additions on the property. | Land | Improvement |
|---|---|---|---|---|
| 2025 | $1,182 | $146,745 | $67,699 | $79,046 |
| 2023 | $1,172 | $127,240 | $60,445 | $66,795 |
| 2022 | $1,018 | $106,330 | $54,950 | $51,380 |
| 2021 | $821 | $85,725 | $34,345 | $51,380 |
| 2020 | $790 | $72,905 | $26,950 | $45,955 |
| 2019 | $800 | $70,440 | $26,950 | $43,490 |
| 2018 | $777 | $66,925 | $23,435 | $43,490 |
| 2017 | $733 | $61,590 | $23,435 | $38,155 |
| 2016 | $746 | $59,385 | $23,435 | $35,950 |
| 2015 | $739 | $55,590 | $0 | $0 |
| 2014 | $775 | $55,580 | $0 | $0 |
Source: Public Records
Map
Nearby Homes