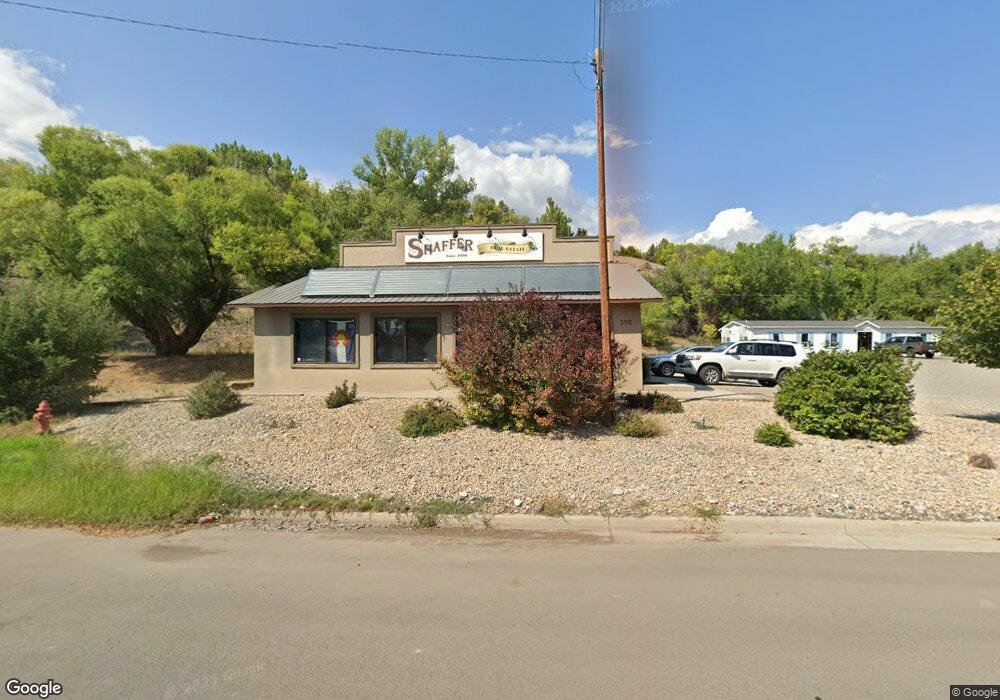
390 W Bridge St Hotchkiss, CO 81419
Estimated Value: $365,000 - $474,000
--
Bed
1
Bath
3,200
Sq Ft
$135/Sq Ft
Est. Value
About This Home
This home is located at 390 W Bridge St, Hotchkiss, CO 81419 and is currently estimated at $433,164, approximately $135 per square foot. 390 W Bridge St is a home located in Delta County with nearby schools including Hotchkiss Elementary School and North Fork High School.
Ownership History
Date
Name
Owned For
Owner Type
Purchase Details
Closed on
Mar 19, 2024
Sold by
Morford Scott
Bought by
Austin Main Street Llc
Current Estimated Value
Purchase Details
Closed on
Dec 28, 2012
Sold by
Myrtle John T and Myrtle Patricia A
Bought by
Morford Scott
Home Financials for this Owner
Home Financials are based on the most recent Mortgage that was taken out on this home.
Original Mortgage
$63,000
Interest Rate
5%
Mortgage Type
Seller Take Back
Purchase Details
Closed on
Mar 25, 2011
Sold by
Kingfisher Trust
Bought by
Myrtle John T and Myrtle Patricia A
Purchase Details
Closed on
Nov 15, 1999
Sold by
Roberts
Bought by
Morford Scott and Kingfisher Trust
Purchase Details
Closed on
Aug 31, 1987
Sold by
Arnold Gerald
Bought by
Morford Scott and Roberts Tom
Purchase Details
Closed on
Dec 11, 1986
Sold by
Mims Powell
Bought by
Morford Scott and Arnold Gerald
Create a Home Valuation Report for This Property
The Home Valuation Report is an in-depth analysis detailing your home's value as well as a comparison with similar homes in the area
Home Values in the Area
Average Home Value in this Area
Purchase History
| Date | Buyer | Sale Price | Title Company |
|---|---|---|---|
| Austin Main Street Llc | $425,000 | None Listed On Document | |
| Morford Scott | $350,000 | Heritage Title | |
| Myrtle John T | $115,000 | Heritage Title | |
| Morford Scott | $80,000 | -- | |
| Morford Scott | $55,000 | -- | |
| Morford Scott | $115,000 | -- |
Source: Public Records
Mortgage History
| Date | Status | Borrower | Loan Amount |
|---|---|---|---|
| Previous Owner | Morford Scott | $63,000 |
Source: Public Records
Tax History Compared to Growth
Tax History
| Year | Tax Paid | Tax Assessment Tax Assessment Total Assessment is a certain percentage of the fair market value that is determined by local assessors to be the total taxable value of land and additions on the property. | Land | Improvement |
|---|---|---|---|---|
| 2024 | $6,566 | $86,496 | $23,715 | $62,781 |
| 2023 | $6,566 | $86,496 | $23,715 | $62,781 |
| 2022 | $6,000 | $80,861 | $24,650 | $56,211 |
| 2021 | $5,854 | $80,861 | $24,650 | $56,211 |
| 2020 | $6,321 | $86,031 | $33,173 | $52,858 |
| 2019 | $6,209 | $86,031 | $33,173 | $52,858 |
| 2018 | $5,796 | $77,217 | $29,000 | $48,217 |
| 2017 | $5,190 | $77,217 | $29,000 | $48,217 |
| 2016 | $4,764 | $73,678 | $36,129 | $37,549 |
| 2014 | -- | $74,030 | $14,500 | $59,530 |
Source: Public Records
Map
Nearby Homes
- 120 Pinion Dr
- 160 Oak Dr
- 461 Willow Dr
- 611 Cottonwood Ln
- 135 4th St
- 579 E Bridge St
- 856 Short Rd
- TBD Powell Mesa Rd
- 33059 J Rd
- 32504 Highway 92
- 9627 3200 Rd
- 11762 3550 Rd
- 34797 Powell Mesa Rd
- 3300 F50 Rd
- TBD Mystic Mesa Rd
- 12216 Mystic Mesa Rd
- TBD 5 3400 Rd
- 9845 3775 Rd
- no address J Rd
- 8577 Linn Ave
- 185 W Bridge St
- 360 W Bridge St
- 360 W Bridge St
- 110 Pinion Dr
- 379 W Bridge St
- 328 W Bridge St
- 320 W Bridge St
- 404 W Hotchkiss Ave
- 314 W Bridge St Unit 334
- 314 W Bridge St
- 335 W Bridge St
- 370 W Hotchkiss Ave
- 108 Cedar Dr
- 310 W Bridge St
- 321 W Bridge St
- 136 Cedar Dr
- 428 W Hotchkiss Ave
- 358 W Hotchkiss Ave
- 301 W Bridge St
- 484 Duke Hill Rd