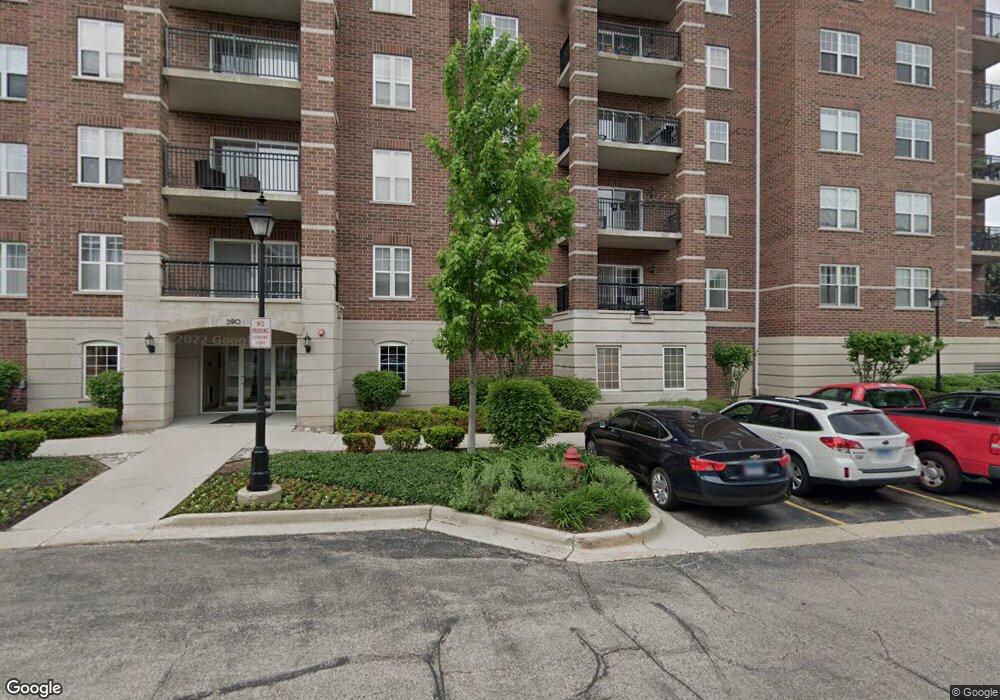
390 W Mahogany Ct Unit 4609 Palatine, IL 60067
Downtown Palatine NeighborhoodEstimated Value: $254,868 - $323,000
1
Bed
--
Bath
1,248
Sq Ft
$228/Sq Ft
Est. Value
About This Home
This home is located at 390 W Mahogany Ct Unit 4609, Palatine, IL 60067 and is currently estimated at $284,467, approximately $227 per square foot. 390 W Mahogany Ct Unit 4609 is a home located in Cook County with nearby schools including Stuart R Paddock School, Plum Grove Jr High School, and William Fremd High School.
Ownership History
Date
Name
Owned For
Owner Type
Purchase Details
Closed on
Jul 17, 2018
Sold by
Twarog Piotr
Bought by
Albany Bank & Trust Company N A and Trust Number 11 6478
Current Estimated Value
Purchase Details
Closed on
Aug 10, 2017
Sold by
Wells Fargo Bank Na
Bought by
Twarog Piotr
Purchase Details
Closed on
Apr 13, 2017
Sold by
Fahmy Sophie A
Bought by
Wells Fargo Bank Na and Freddie Mac Securities Remic Trust
Purchase Details
Closed on
Aug 31, 2016
Sold by
Fahmy Sophie and Schnuda Charles
Bought by
Fahmy Sophie
Purchase Details
Closed on
May 31, 2005
Sold by
Groves Of Palatine Llc
Bought by
Fahmy Sophie and Schnuda Charles D
Home Financials for this Owner
Home Financials are based on the most recent Mortgage that was taken out on this home.
Original Mortgage
$200,040
Interest Rate
4.45%
Mortgage Type
Negative Amortization
Create a Home Valuation Report for This Property
The Home Valuation Report is an in-depth analysis detailing your home's value as well as a comparison with similar homes in the area
Home Values in the Area
Average Home Value in this Area
Purchase History
| Date | Buyer | Sale Price | Title Company |
|---|---|---|---|
| Albany Bank & Trust Company N A | -- | Attorney | |
| Twarog Piotr | $149,500 | Attorney | |
| Wells Fargo Bank Na | -- | Attorney | |
| Fahmy Sophie | -- | Chicago Title Insurance Comp | |
| Fahmy Sophie | $248,000 | Chicago Title Insurance Comp |
Source: Public Records
Mortgage History
| Date | Status | Borrower | Loan Amount |
|---|---|---|---|
| Previous Owner | Fahmy Sophie | $200,040 |
Source: Public Records
Tax History Compared to Growth
Tax History
| Year | Tax Paid | Tax Assessment Tax Assessment Total Assessment is a certain percentage of the fair market value that is determined by local assessors to be the total taxable value of land and additions on the property. | Land | Improvement |
|---|---|---|---|---|
| 2024 | $5,046 | $17,046 | $131 | $16,915 |
| 2023 | $4,882 | $17,046 | $131 | $16,915 |
| 2022 | $4,882 | $17,046 | $131 | $16,915 |
| 2021 | $4,703 | $14,482 | $76 | $14,406 |
| 2020 | $4,633 | $14,482 | $76 | $14,406 |
| 2019 | $4,622 | $16,118 | $76 | $16,042 |
| 2018 | $4,152 | $13,362 | $70 | $13,292 |
| 2017 | $4,074 | $13,362 | $70 | $13,292 |
| 2016 | $3,789 | $13,362 | $70 | $13,292 |
| 2015 | $2,632 | $13,064 | $65 | $12,999 |
| 2014 | $4,173 | $13,749 | $65 | $13,684 |
| 2013 | $4,066 | $13,749 | $65 | $13,684 |
Source: Public Records
Map
Nearby Homes
- 390 W Mahogany Ct Unit 606
- 410 W Mahogany Ct Unit 309
- 435 W Wood St Unit 402A
- 470 W Mahogany Ct Unit 408
- 480 W Wood St Unit 3
- Lot 1 W Wilson St
- 235 N Smith St Unit 401
- 566 W Bridge View Ct
- 241 N Brockway St
- 133 W Palatine Rd Unit 107A
- 315 Johnson St
- 87 W Station St
- 108 S Hickory St
- 24 W Station St Unit 403W
- 4 E Slade St
- 2 E Slade St
- 3 E Slade St
- 445 N Cambridge Dr
- 222 S Maple St
- 550 N Quentin Rd
- 390 W Mahogany Ct Unit 202
- 390 W Mahogany Ct Unit 4603
- 390 W Mahogany Ct Unit 4503
- 390 W Mahogany Ct Unit 4501
- 390 W Mahogany Ct Unit 4403
- 390 W Mahogany Ct Unit 4207
- 390 W Mahogany Ct Unit 4201
- 390 W Mahogany Ct Unit 4311
- 390 W Mahogany Ct Unit 4505
- 390 W Mahogany Ct Unit 4610
- 390 W Mahogany Ct Unit 4202
- 390 W Mahogany Ct Unit 4405
- 390 W Mahogany Ct Unit 4305
- 390 W Mahogany Ct Unit 4205
- 390 W Mahogany Ct Unit 4301
- 390 W Mahogany Ct Unit 4308
- 390 W Mahogany Ct Unit 4409
- 390 W Mahogany Ct Unit 4702
- 390 W Mahogany Ct Unit 4307
- 390 W Mahogany Ct Unit 4705