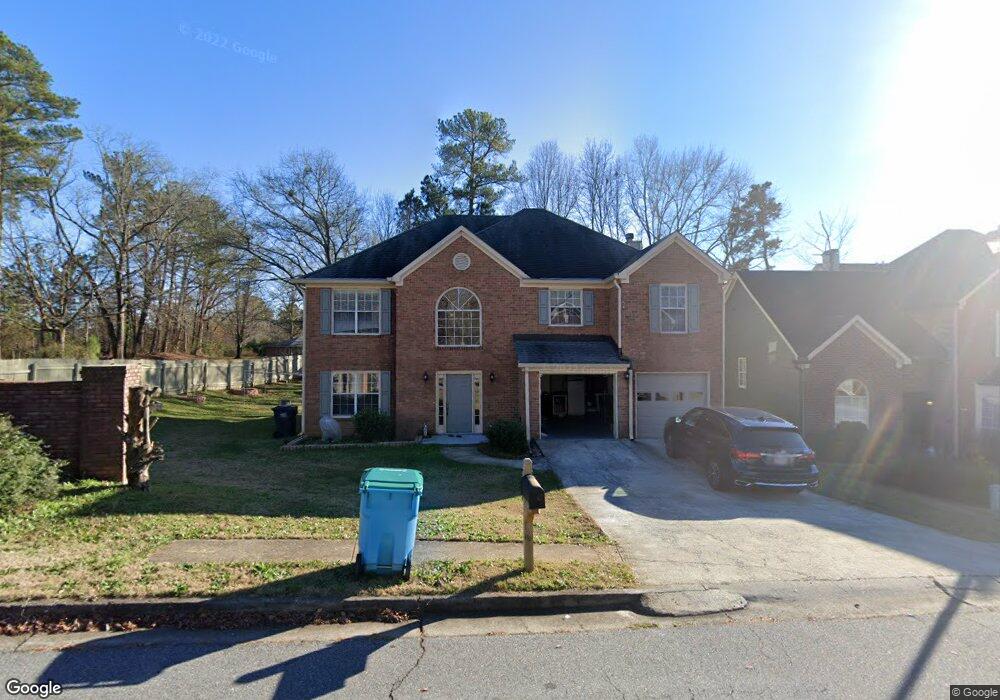
3900 Fallbrook Dr Unit 1 Duluth, GA 30096
Estimated Value: $420,000 - $447,000
4
Beds
3
Baths
2,396
Sq Ft
$182/Sq Ft
Est. Value
About This Home
This home is located at 3900 Fallbrook Dr Unit 1, Duluth, GA 30096 and is currently estimated at $434,923, approximately $181 per square foot. 3900 Fallbrook Dr Unit 1 is a home located in Gwinnett County with nearby schools including Charles Brant Chesney Elementary School, Duluth Middle School, and Duluth High School.
Ownership History
Date
Name
Owned For
Owner Type
Purchase Details
Closed on
Sep 8, 2017
Sold by
Nguyen Hong Nhung
Bought by
Nguyen Nhung Hong and Luong Hang Thuy
Current Estimated Value
Home Financials for this Owner
Home Financials are based on the most recent Mortgage that was taken out on this home.
Original Mortgage
$163,200
Outstanding Balance
$86,186
Interest Rate
3.9%
Mortgage Type
New Conventional
Estimated Equity
$348,737
Purchase Details
Closed on
Jan 27, 2006
Sold by
Cash Carolyn
Bought by
Nguyen Hong N
Home Financials for this Owner
Home Financials are based on the most recent Mortgage that was taken out on this home.
Original Mortgage
$180,000
Interest Rate
6.21%
Mortgage Type
New Conventional
Purchase Details
Closed on
Feb 28, 1994
Sold by
Quinn Ridge Group
Bought by
Cash Carolyn
Home Financials for this Owner
Home Financials are based on the most recent Mortgage that was taken out on this home.
Original Mortgage
$108,900
Interest Rate
6.96%
Create a Home Valuation Report for This Property
The Home Valuation Report is an in-depth analysis detailing your home's value as well as a comparison with similar homes in the area
Home Values in the Area
Average Home Value in this Area
Purchase History
| Date | Buyer | Sale Price | Title Company |
|---|---|---|---|
| Nguyen Nhung Hong | -- | -- | |
| Nguyen Hong N | $205,000 | -- | |
| Cash Carolyn | $123,900 | -- |
Source: Public Records
Mortgage History
| Date | Status | Borrower | Loan Amount |
|---|---|---|---|
| Open | Nguyen Nhung Hong | $163,200 | |
| Previous Owner | Nguyen Hong N | $180,000 | |
| Previous Owner | Cash Carolyn | $108,900 |
Source: Public Records
Tax History
| Year | Tax Paid | Tax Assessment Tax Assessment Total Assessment is a certain percentage of the fair market value that is determined by local assessors to be the total taxable value of land and additions on the property. | Land | Improvement |
|---|---|---|---|---|
| 2025 | $4,962 | $185,040 | $34,000 | $151,040 |
| 2024 | $4,468 | $153,840 | $30,000 | $123,840 |
| 2023 | $4,468 | $145,160 | $26,000 | $119,160 |
| 2022 | $4,251 | $145,160 | $26,000 | $119,160 |
| 2021 | $3,417 | $102,520 | $20,000 | $82,520 |
| 2020 | $3,440 | $102,520 | $20,000 | $82,520 |
| 2019 | $3,340 | $102,520 | $20,000 | $82,520 |
| 2018 | $3,027 | $87,960 | $16,000 | $71,960 |
| 2016 | $2,846 | $78,640 | $15,200 | $63,440 |
| 2015 | $2,648 | $71,440 | $15,200 | $56,240 |
| 2014 | $2,627 | $70,480 | $12,000 | $58,480 |
Source: Public Records
Map
Nearby Homes
- 2347 Fawn Hollow Ct Unit 1
- 2239 Dandridge Dr
- 2251 Grovemont Dr
- 4091 Beaver Oaks Dr
- 3614 Gainesway Trace
- 3593 Gainesway Ct
- 4240 Berkeley Mill Ln
- 2152 Graywell Ln
- 4270 Berkeley Mill Ln
- 4220 E Meadow Dr
- 2535 Rhoanoke Dr
- 4300 Wildridge Dr
- 4110 Megan Rd Unit 2
- 3053 Hartright Bend Ct
- 3049 Hartright Bend Ct
- 3945 Genoa Ct
- 2207 Hopkins Terrace
- 3576 Randy Place
- 3125 Oxwell Dr Unit IB
- 3980 Howell Park Rd
- 3910 Fallbrook Dr
- 3920 Fallbrook Dr
- 2020 Garden Hill Dr
- 3905 Fallbrook Dr
- 2010 Garden Hill Dr
- 3915 Fallbrook Dr
- 3930 Fallbrook Dr
- 3925 Fallbrook Dr
- 2000 Garden Hill Dr
- 3940 Fallbrook Dr
- 3916 Davis Cir
- 1990 Garden Hill Dr
- 3916 Old Norcross Rd
- 3950 Fallbrook Dr Unit 1
- 2357 Fawn Hollow Ct
- 2295 Berkeley Cove Ct
- 2367 Fawn Hollow Ct Unit 1
- 2295 Berkeley Cove Ct NW
- 2001 Garden Hill Dr
- 1980 Garden Hill Dr
Your Personal Tour Guide
Ask me questions while you tour the home.