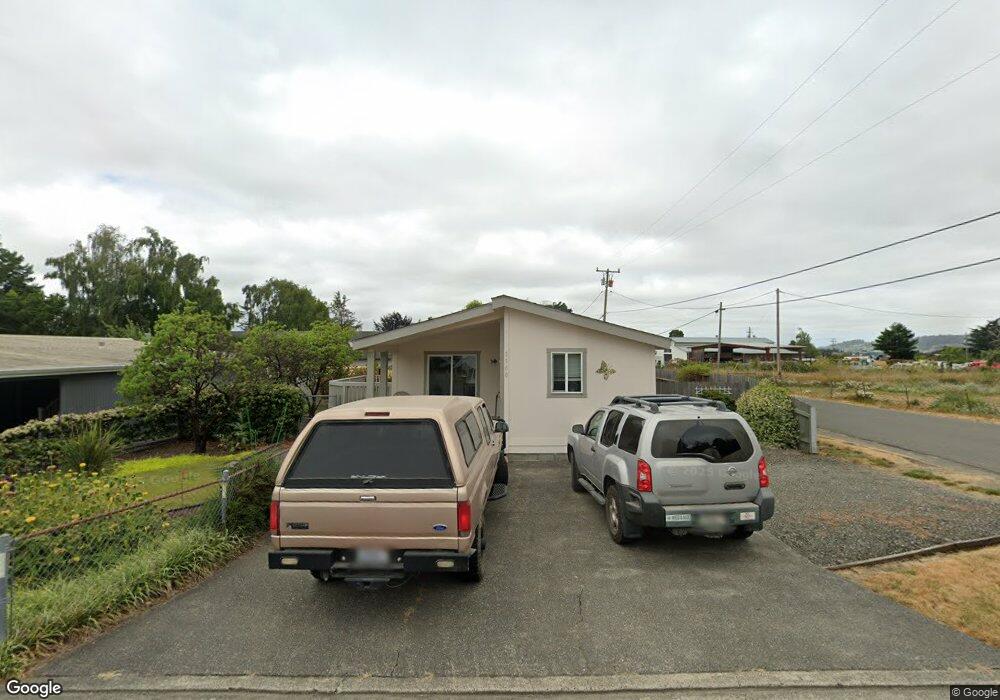
3900 Loop Ct Fortuna, CA 95540
Estimated Value: $265,000 - $342,202
2
Beds
1
Bath
500
Sq Ft
$603/Sq Ft
Est. Value
About This Home
This home is located at 3900 Loop Ct, Fortuna, CA 95540 and is currently estimated at $301,301, approximately $602 per square foot. 3900 Loop Ct is a home located in Humboldt County with nearby schools including East High School, Fortuna Union High School, and Redwood Preparatory Charter School.
Ownership History
Date
Name
Owned For
Owner Type
Purchase Details
Closed on
Jul 6, 2012
Sold by
Michener Carol
Bought by
Michener Michener Carol L Carol L
Current Estimated Value
Home Financials for this Owner
Home Financials are based on the most recent Mortgage that was taken out on this home.
Original Mortgage
$103,167
Outstanding Balance
$71,080
Interest Rate
3.63%
Mortgage Type
New Conventional
Estimated Equity
$230,221
Purchase Details
Closed on
Oct 24, 2007
Sold by
Michener Ronald K and Michener Carol L
Bought by
Michener Ronald K and Michener Carol L
Purchase Details
Closed on
Apr 23, 2007
Sold by
Cromwell Gordon and Cromwell Edna B
Bought by
Michener Ronald K and Michener Carol L
Purchase Details
Closed on
Sep 13, 2006
Sold by
Cromwell Gordon and Cromwell Edna B
Bought by
Cromwell Gordon and Cromwell Edna B
Create a Home Valuation Report for This Property
The Home Valuation Report is an in-depth analysis detailing your home's value as well as a comparison with similar homes in the area
Home Values in the Area
Average Home Value in this Area
Purchase History
| Date | Buyer | Sale Price | Title Company |
|---|---|---|---|
| Michener Michener Carol L Carol L | -- | Fidelity National Title Comp | |
| Michener Carol | -- | Fidelity National Title Comp | |
| Michener Ronald K | -- | None Available | |
| Michener Ronald K | $135,000 | First American Title Co | |
| Cromwell Gordon | -- | None Available |
Source: Public Records
Mortgage History
| Date | Status | Borrower | Loan Amount |
|---|---|---|---|
| Open | Michener Carol | $103,167 |
Source: Public Records
Tax History
| Year | Tax Paid | Tax Assessment Tax Assessment Total Assessment is a certain percentage of the fair market value that is determined by local assessors to be the total taxable value of land and additions on the property. | Land | Improvement |
|---|---|---|---|---|
| 2025 | $2,684 | $252,532 | $158,084 | $94,448 |
| 2024 | $2,684 | $247,582 | $154,985 | $92,597 |
| 2023 | $2,633 | $242,729 | $151,947 | $90,782 |
| 2022 | $2,625 | $237,970 | $148,968 | $89,002 |
| 2021 | $2,587 | $233,305 | $146,048 | $87,257 |
| 2020 | $2,584 | $230,914 | $144,551 | $86,363 |
| 2019 | $2,537 | $226,387 | $141,717 | $84,670 |
| 2018 | $2,569 | $221,949 | $138,939 | $83,010 |
| 2017 | $2,451 | $217,598 | $136,215 | $81,383 |
| 2016 | $2,394 | $213,333 | $133,545 | $79,788 |
| 2015 | $1,680 | $151,580 | $131,540 | $20,040 |
| 2014 | $1,640 | $148,612 | $128,964 | $19,648 |
Source: Public Records
Map
Nearby Homes
- 3888 Rohnerville Rd
- 1727 Bluejay Ct
- 3580 Larsen Ln
- 4111 Rohnerville Rd
- 3581 Clifton Way
- 4372 Forest Hills Dr
- 3629 Kenmar Rd
- 1777 Xavier Ct
- 1545 Xavier Ct
- 109 Pampas Ln
- 3414 Church St
- 148 Ridge View Ct
- 3410 School St
- 3310 School St
- 3746 Jones Ct
- 00 View Dr
- 462 Francesco Place
- 3200 Matthew Ln
- 3449 Trinity St
- 458 Guido Ave
Your Personal Tour Guide
Ask me questions while you tour the home.