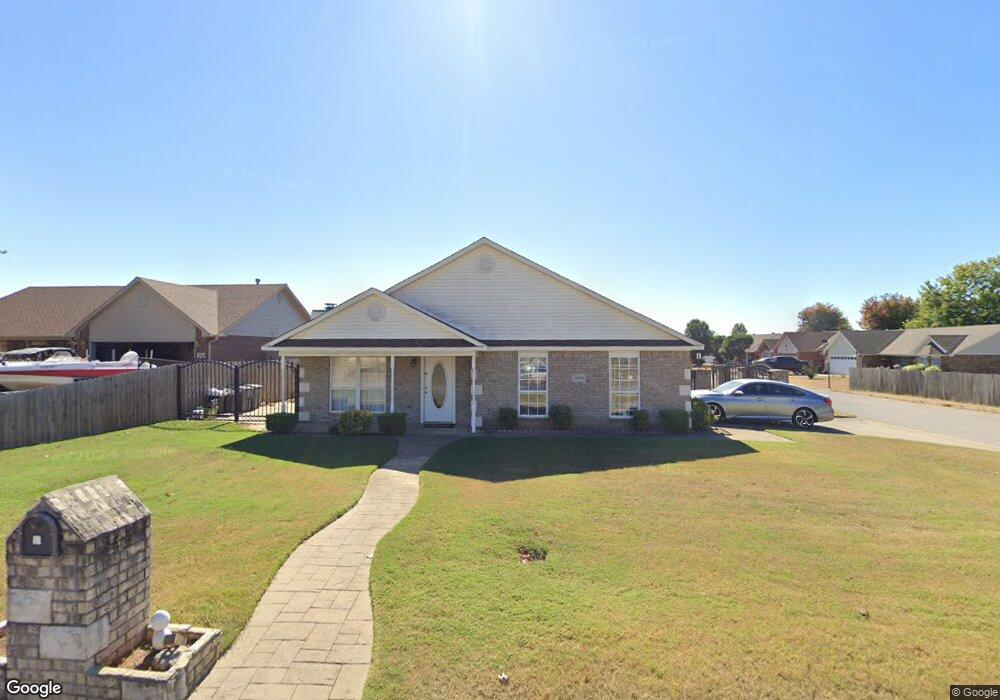
3900 Owen St van Buren, AR 72956
Estimated Value: $171,000 - $231,000
--
Bed
2
Baths
1,260
Sq Ft
$157/Sq Ft
Est. Value
About This Home
This home is located at 3900 Owen St, van Buren, AR 72956 and is currently estimated at $197,273, approximately $156 per square foot. 3900 Owen St is a home located in Crawford County with nearby schools including King Elementary School, Butterfield Trail Middle School, and Van Buren High School.
Ownership History
Date
Name
Owned For
Owner Type
Purchase Details
Closed on
Mar 14, 2015
Sold by
Parga Maria and Parga Juan
Bought by
Alvarez Cecilia E and Macias Iganacio
Current Estimated Value
Home Financials for this Owner
Home Financials are based on the most recent Mortgage that was taken out on this home.
Original Mortgage
$100,152
Outstanding Balance
$68,538
Interest Rate
3.68%
Mortgage Type
FHA
Estimated Equity
$128,735
Purchase Details
Closed on
Mar 26, 2004
Bought by
Ronald Ragon-Chacon
Create a Home Valuation Report for This Property
The Home Valuation Report is an in-depth analysis detailing your home's value as well as a comparison with similar homes in the area
Home Values in the Area
Average Home Value in this Area
Purchase History
| Date | Buyer | Sale Price | Title Company |
|---|---|---|---|
| Alvarez Cecilia E | -- | None Available | |
| Ronald Ragon-Chacon | $95,000 | -- |
Source: Public Records
Mortgage History
| Date | Status | Borrower | Loan Amount |
|---|---|---|---|
| Open | Alvarez Cecilia E | $100,152 |
Source: Public Records
Tax History Compared to Growth
Tax History
| Year | Tax Paid | Tax Assessment Tax Assessment Total Assessment is a certain percentage of the fair market value that is determined by local assessors to be the total taxable value of land and additions on the property. | Land | Improvement |
|---|---|---|---|---|
| 2025 | $1,456 | $36,370 | $3,000 | $33,370 |
| 2024 | $1,344 | $36,370 | $3,000 | $33,370 |
| 2023 | $1,232 | $36,370 | $3,000 | $33,370 |
| 2022 | $1,120 | $21,580 | $3,000 | $18,580 |
| 2021 | $1,120 | $21,580 | $3,000 | $18,580 |
| 2020 | $1,120 | $21,580 | $3,000 | $18,580 |
| 2019 | $1,120 | $21,580 | $3,000 | $18,580 |
| 2018 | $1,120 | $21,580 | $3,000 | $18,580 |
| 2017 | $1,185 | $22,830 | $3,000 | $19,830 |
| 2016 | $1,185 | $22,830 | $3,000 | $19,830 |
| 2015 | $766 | $22,830 | $3,000 | $19,830 |
| 2014 | -- | $22,830 | $3,000 | $19,830 |
Source: Public Records
Map
Nearby Homes