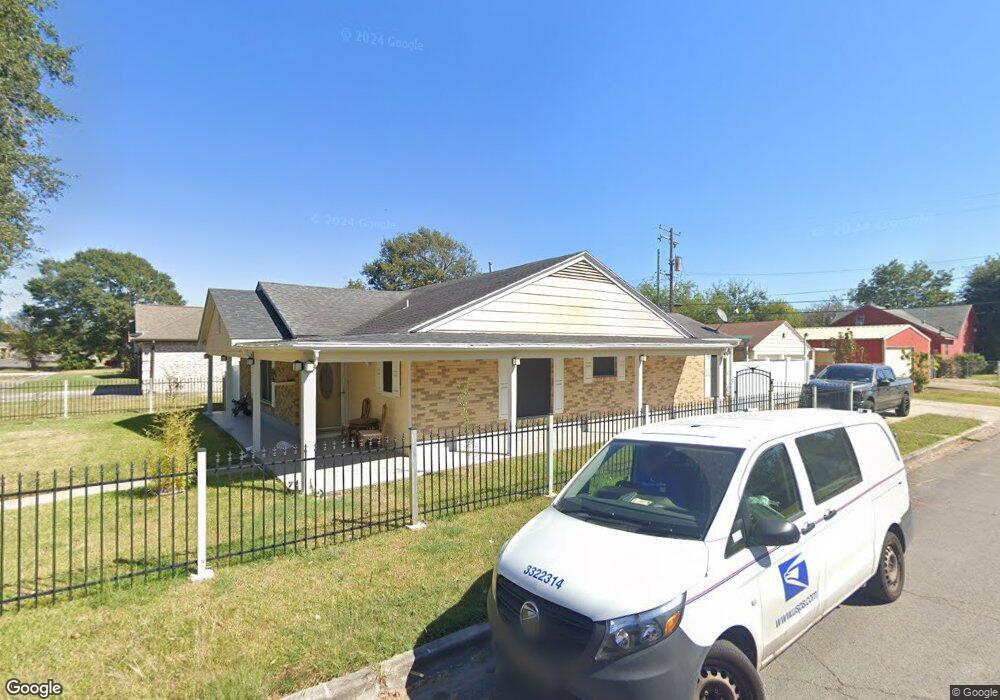
3900 Procter St Port Arthur, TX 77642
Estimated Value: $109,000 - $136,000
2
Beds
2
Baths
1,676
Sq Ft
$73/Sq Ft
Est. Value
About This Home
This home is located at 3900 Procter St, Port Arthur, TX 77642 and is currently estimated at $121,533, approximately $72 per square foot. 3900 Procter St is a home located in Jefferson County with nearby schools including Lakeview Elementary School, Jefferson Middle School, and Memorial High School.
Ownership History
Date
Name
Owned For
Owner Type
Purchase Details
Closed on
Nov 13, 2020
Sold by
Truong Hien
Bought by
Truong Hoa V
Current Estimated Value
Purchase Details
Closed on
Nov 5, 2019
Sold by
Le Hai V
Bought by
Truong Hien
Purchase Details
Closed on
Jan 23, 2017
Sold by
Sanders Carld D and Sanders Gaynell
Bought by
Le Hai V
Purchase Details
Closed on
Feb 20, 2015
Sold by
As Arete Llc
Bought by
Sanders Carl D and Sanders Gaynell
Purchase Details
Closed on
Apr 10, 2014
Sold by
Friels George and Friels Barbara J
Bought by
As Arete Llc
Create a Home Valuation Report for This Property
The Home Valuation Report is an in-depth analysis detailing your home's value as well as a comparison with similar homes in the area
Home Values in the Area
Average Home Value in this Area
Purchase History
| Date | Buyer | Sale Price | Title Company |
|---|---|---|---|
| Truong Hoa V | -- | None Available | |
| Truong Hien | -- | None Available | |
| Troung Hoa | -- | None Available | |
| Le Hai V | -- | Stewart Title | |
| Sanders Carl D | -- | None Available | |
| As Arete Llc | $40,296 | None Available |
Source: Public Records
Tax History Compared to Growth
Tax History
| Year | Tax Paid | Tax Assessment Tax Assessment Total Assessment is a certain percentage of the fair market value that is determined by local assessors to be the total taxable value of land and additions on the property. | Land | Improvement |
|---|---|---|---|---|
| 2025 | $3,891 | $134,924 | $6,750 | $128,174 |
| 2024 | $3,891 | $135,832 | $2,910 | $132,922 |
| 2023 | $3,891 | $116,843 | $2,910 | $113,933 |
| 2022 | $3,711 | $116,843 | $2,910 | $113,933 |
| 2021 | $3,265 | $98,508 | $2,910 | $95,598 |
| 2020 | $1,319 | $40,682 | $2,910 | $37,772 |
| 2019 | $1,237 | $38,160 | $2,910 | $35,250 |
| 2018 | $1,216 | $38,160 | $2,910 | $35,250 |
| 2017 | $1,382 | $44,610 | $2,910 | $41,700 |
| 2016 | $1,307 | $44,610 | $2,910 | $41,700 |
| 2015 | $983 | $44,610 | $2,910 | $41,700 |
| 2014 | $983 | $44,610 | $2,910 | $41,700 |
Source: Public Records
Map
Nearby Homes