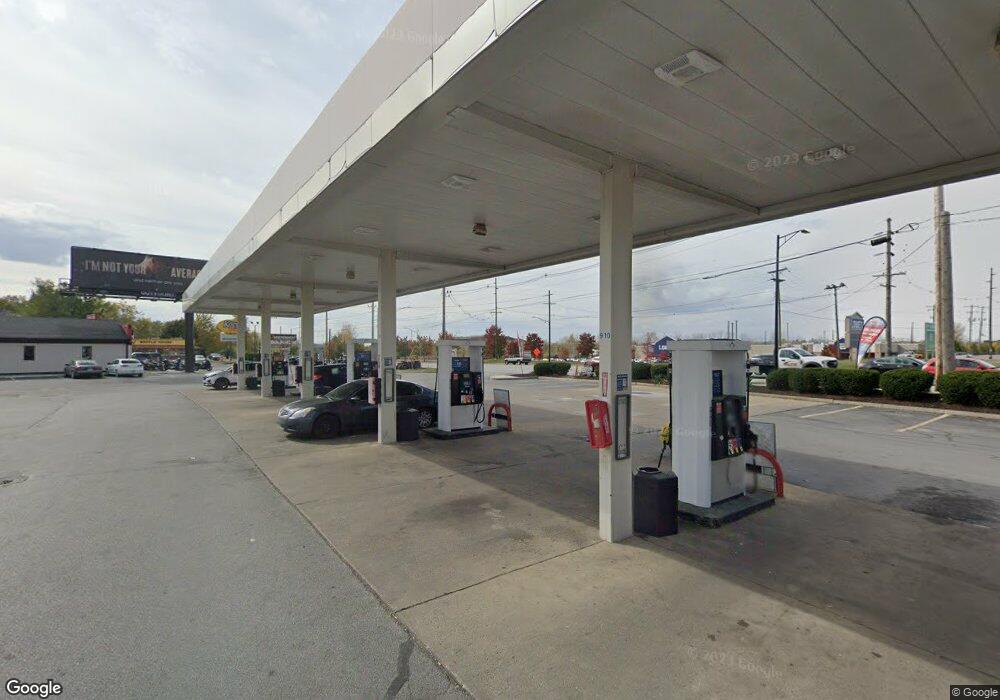
3900 S High St Columbus, OH 43207
Obetz-Lockbourne NeighborhoodEstimated Value: $6,122,551
--
Bed
--
Bath
6,240
Sq Ft
$981/Sq Ft
Est. Value
About This Home
This home is located at 3900 S High St, Columbus, OH 43207 and is currently estimated at $6,122,551, approximately $981 per square foot. 3900 S High St is a home located in Franklin County with nearby schools including Cedarwood Alternative Elementary School @ Stockbri, Buckeye Middle School, and Marion-Franklin High School.
Ownership History
Date
Name
Owned For
Owner Type
Purchase Details
Closed on
Mar 30, 2023
Sold by
Th Midwest Inc
Bought by
City Of Columbus Ohio
Current Estimated Value
Purchase Details
Closed on
Mar 23, 2023
Sold by
Th Midwest Inc
Bought by
City Of Columbus Ohio
Purchase Details
Closed on
Oct 8, 2009
Sold by
Gilligan Oil Company Llc
Bought by
Th Midwest Inc
Purchase Details
Closed on
Oct 14, 2005
Sold by
Ace Real Property Investments Llc
Bought by
Gilligan Oil Co
Purchase Details
Closed on
Aug 9, 2004
Sold by
Castle Christopher L and Castle Gina A
Bought by
Ace Real Property Investments Llc
Purchase Details
Closed on
Nov 18, 2003
Sold by
Castle Wayne D and Castle Peggy A
Bought by
Castle Christopher L
Home Financials for this Owner
Home Financials are based on the most recent Mortgage that was taken out on this home.
Original Mortgage
$2,000,000
Interest Rate
6.1%
Mortgage Type
Commercial
Purchase Details
Closed on
Dec 23, 1985
Bought by
Castle Wayne D
Purchase Details
Closed on
Oct 1, 1983
Create a Home Valuation Report for This Property
The Home Valuation Report is an in-depth analysis detailing your home's value as well as a comparison with similar homes in the area
Home Values in the Area
Average Home Value in this Area
Purchase History
| Date | Buyer | Sale Price | Title Company |
|---|---|---|---|
| City Of Columbus Ohio | -- | None Listed On Document | |
| City Of Columbus Ohio | -- | None Listed On Document | |
| Th Midwest Inc | $2,452,000 | Attorney | |
| Gilligan Oil Co | $1,675,000 | Fati | |
| Ace Real Property Investments Llc | -- | -- | |
| Castle Christopher L | $1,000,000 | -- | |
| Castle Wayne D | $20,000 | -- | |
| -- | $137,200 | -- |
Source: Public Records
Mortgage History
| Date | Status | Borrower | Loan Amount |
|---|---|---|---|
| Previous Owner | Castle Christopher L | $2,000,000 |
Source: Public Records
Tax History Compared to Growth
Tax History
| Year | Tax Paid | Tax Assessment Tax Assessment Total Assessment is a certain percentage of the fair market value that is determined by local assessors to be the total taxable value of land and additions on the property. | Land | Improvement |
|---|---|---|---|---|
| 2024 | $65,444 | $881,730 | $242,730 | $639,000 |
| 2023 | $73,283 | $1,003,205 | $364,210 | $638,995 |
| 2022 | $39,634 | $528,500 | $430,220 | $98,280 |
| 2021 | $69,743 | $913,850 | $430,220 | $483,630 |
| 2020 | $68,354 | $913,850 | $430,220 | $483,630 |
| 2019 | $71,679 | $870,310 | $409,710 | $460,600 |
| 2018 | $35,725 | $870,310 | $409,710 | $460,600 |
| 2017 | $71,597 | $870,310 | $409,710 | $460,600 |
| 2016 | $38,074 | $437,500 | $192,500 | $245,000 |
| 2015 | $34,671 | $858,200 | $409,710 | $448,490 |
| 2014 | $69,310 | $858,200 | $409,710 | $448,490 |
| 2013 | $34,342 | $858,200 | $409,710 | $448,490 |
Source: Public Records
Map
Nearby Homes
- 0 Jana Kay Ct
- 236 Roundtop Rd
- 312 Harland Dr
- 4125 Martinsburg Dr
- 4296 Oakwind Dr
- 4132 Martinsburg Dr
- 4141 Kershaw Dr
- 245 Marilla Rd
- 0 Parsons Ave Unit 225012522
- 493 Oak Village Dr
- 568 Glendora Rd
- 3714 Parsons Ave
- 3861 Frazier Rd W
- 552 Harland Dr
- 3927 Frazier Rd E
- 202 Williams Rd
- 3863 Edendale Rd
- 525 Ashwood Rd
- 3691 Ferman Rd
- 3691 Abney Rd