Estimated Value: $388,000 - $423,000
3
Beds
2
Baths
2,764
Sq Ft
$148/Sq Ft
Est. Value
About This Home
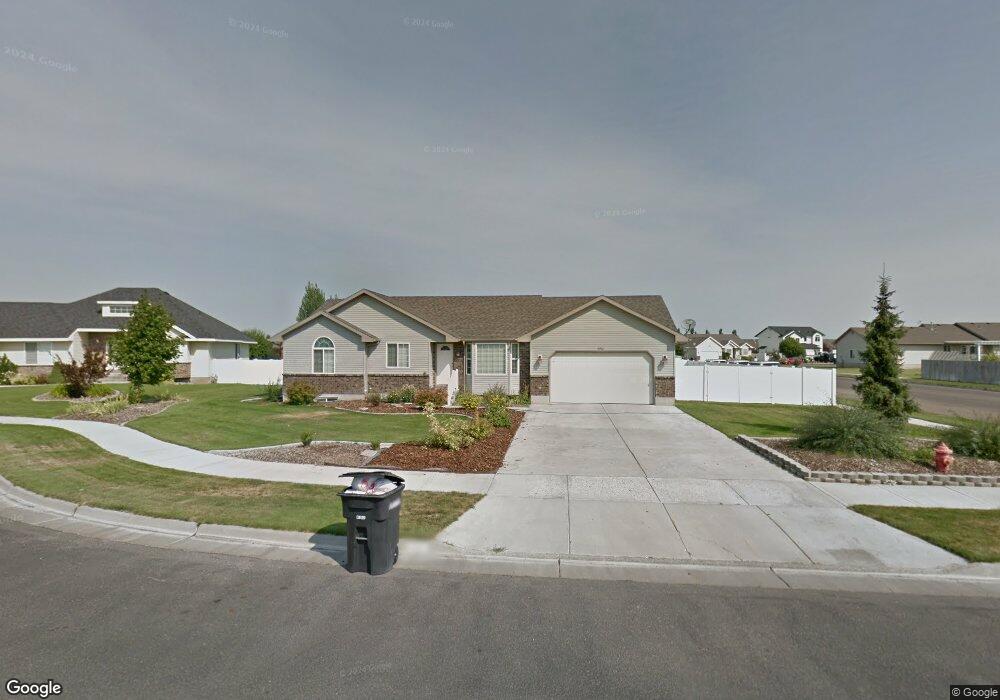
This home is located at 3901 Benchmark Cir, Ammon, ID 83406 and is currently estimated at $409,610, approximately $148 per square foot. 3901 Benchmark Cir is a home located in Bonneville County with nearby schools including Tiebreaker Elementary School, Sandcreek Middle School, and Hillcrest High School.
Ownership History
Date
Name
Owned For
Owner Type
Purchase Details
Closed on
Feb 6, 2009
Sold by
Jackson Kim and Jackson Jim Preston
Bought by
Jackson Jim Preston
Current Estimated Value
Home Financials for this Owner
Home Financials are based on the most recent Mortgage that was taken out on this home.
Original Mortgage
$179,550
Outstanding Balance
$110,646
Interest Rate
5.04%
Mortgage Type
New Conventional
Estimated Equity
$298,964
Purchase Details
Closed on
Feb 4, 2009
Sold by
Judy Jon and Judy Kristen
Bought by
Jackson Jim Preston
Home Financials for this Owner
Home Financials are based on the most recent Mortgage that was taken out on this home.
Original Mortgage
$179,550
Outstanding Balance
$110,646
Interest Rate
5.04%
Mortgage Type
New Conventional
Estimated Equity
$298,964
Purchase Details
Closed on
Jun 6, 2008
Sold by
Burtenshaw Karla W
Bought by
Judy Jon and Judy Kristen
Create a Home Valuation Report for This Property
The Home Valuation Report is an in-depth analysis detailing your home's value as well as a comparison with similar homes in the area
Purchase History
| Date | Buyer | Sale Price | Title Company |
|---|---|---|---|
| Jackson Jim Preston | -- | -- | |
| Jackson Jim Preston | -- | -- | |
| Judy Jon | -- | Amri Title |
Source: Public Records
Mortgage History
| Date | Status | Borrower | Loan Amount |
|---|---|---|---|
| Open | Jackson Jim Preston | $179,550 |
Source: Public Records
Tax History
| Year | Tax Paid | Tax Assessment Tax Assessment Total Assessment is a certain percentage of the fair market value that is determined by local assessors to be the total taxable value of land and additions on the property. | Land | Improvement |
|---|---|---|---|---|
| 2025 | $1,891 | $491,258 | $91,064 | $400,194 |
| 2024 | $1,772 | $480,818 | $91,064 | $389,754 |
| 2023 | $1,606 | $394,064 | $92,764 | $301,300 |
| 2022 | $1,949 | $360,555 | $62,885 | $297,670 |
| 2021 | $1,782 | $255,541 | $57,131 | $198,410 |
| 2019 | $1,711 | $233,458 | $49,268 | $184,190 |
| 2018 | $1,391 | $222,110 | $35,690 | $186,420 |
| 2017 | $1,311 | $191,026 | $25,926 | $165,100 |
| 2016 | $1,234 | $180,175 | $23,525 | $156,650 |
| 2015 | $1,265 | $177,135 | $23,525 | $153,610 |
| 2014 | $28,204 | $177,135 | $23,525 | $153,610 |
| 2013 | $1,293 | $173,495 | $23,525 | $149,970 |
Source: Public Records
Map
Nearby Homes
- 4113 Birchwood Cir
- 3684 Briar Creek Ln
- 3823 E Summerridge Cir
- 3930 John Adams Pkwy
- 820 S Adam Ln
- 596 S Adam Ln
- 3472 Leroy Dr
- TBD E 17th St
- 939 Clara Ct
- 605 Maurine Dr
- L14 B4 Malheur River St
- 1303 Jackson Dr
- 3345 E Southwick
- 1170 Jackson Dr
- 2602 Baylor Dr
- 4139 Fairview Dr
- 1122 Matchpoint Dr
- 243 S Bridger Dr
- 265 S Heath Ln
- 1406 Bellagio Dr
- 1366 Ross Ave
- 1366 Ross Ave
- 3873 Benchmark Cir
- 3926 E Jordan Creek
- 3935 Benchmark Cir
- 3900 Benchmark Cir
- 3857 Benchmark Cir
- 3934 Benchmark Cir
- 3836 Heartland Cir
- 1334 Ross Ave
- 3848 Heartland Cir
- 3874 Benchmark Cir
- 3858 Benchmark Cir
- 3849 Heartland Cir
- 3839 Silverwood Cir
- 3830 Heartland Cir
- 3907 Milestone Cir
- 3967 Benchmark Cir
- 3827 Silverwood Cir
- 3840 Silverwood Cir
Your Personal Tour Guide
Ask me questions while you tour the home.