Estimated Value: $252,514 - $316,000
--
Bed
2
Baths
1,793
Sq Ft
$157/Sq Ft
Est. Value
About This Home
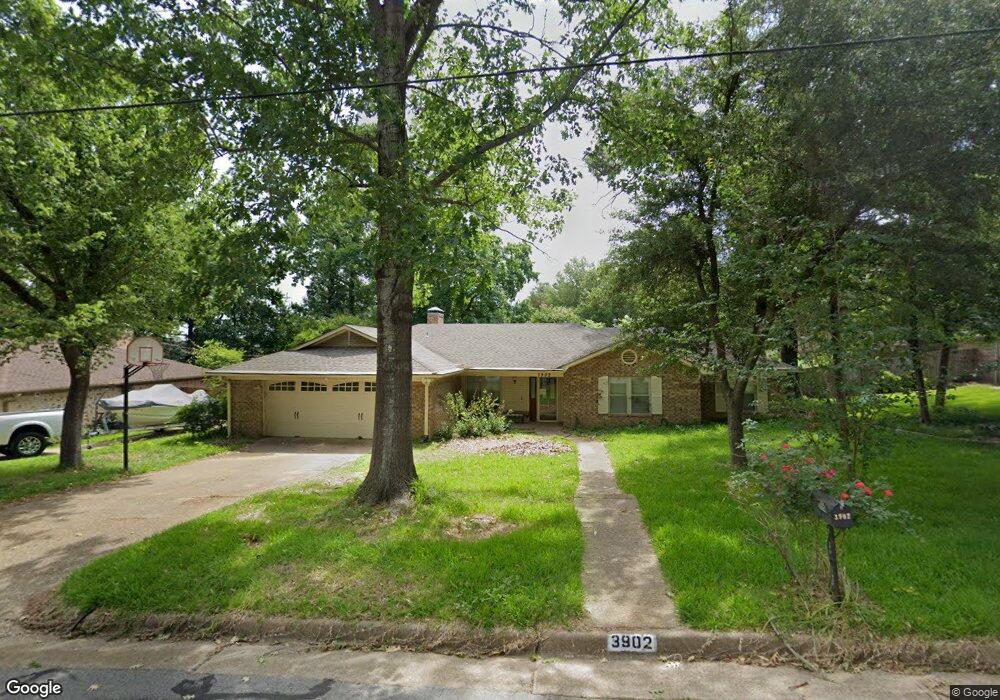
This home is located at 3902 3902 Lexington, Tyler, TX 75701 and is currently estimated at $280,879, approximately $156 per square foot. 3902 3902 Lexington is a home located in Smith County with nearby schools including Clarkston Elementary School, Moore Middle School, and Hubbard Middle School.
Ownership History
Date
Name
Owned For
Owner Type
Purchase Details
Closed on
Oct 22, 2016
Sold by
Mcphail David Charles and Mcphail Pamela Elledge
Bought by
Mcphial John David
Current Estimated Value
Home Financials for this Owner
Home Financials are based on the most recent Mortgage that was taken out on this home.
Original Mortgage
$121,500
Outstanding Balance
$97,467
Interest Rate
3.48%
Estimated Equity
$183,412
Purchase Details
Closed on
Jun 26, 2014
Sold by
Rogers Willard E and Rogers Janet
Bought by
Mcphail David Charles and Mcphail Pamela Elledge
Home Financials for this Owner
Home Financials are based on the most recent Mortgage that was taken out on this home.
Original Mortgage
$121,500
Interest Rate
4.23%
Mortgage Type
New Conventional
Create a Home Valuation Report for This Property
The Home Valuation Report is an in-depth analysis detailing your home's value as well as a comparison with similar homes in the area
Home Values in the Area
Average Home Value in this Area
Purchase History
| Date | Buyer | Sale Price | Title Company |
|---|---|---|---|
| Mcphial John David | -- | None Available | |
| Mcphail David Charles | -- | None Available |
Source: Public Records
Mortgage History
| Date | Status | Borrower | Loan Amount |
|---|---|---|---|
| Open | Mcphial John David | $121,500 | |
| Closed | Mcphail David Charles | $121,500 |
Source: Public Records
Tax History Compared to Growth
Tax History
| Year | Tax Paid | Tax Assessment Tax Assessment Total Assessment is a certain percentage of the fair market value that is determined by local assessors to be the total taxable value of land and additions on the property. | Land | Improvement |
|---|---|---|---|---|
| 2025 | $2,630 | $249,190 | $33,923 | $215,267 |
| 2024 | $2,630 | $211,581 | $29,080 | $218,509 |
| 2023 | $3,353 | $224,291 | $29,080 | $195,211 |
| 2022 | $3,426 | $175,854 | $21,810 | $154,044 |
| 2021 | $3,335 | $158,964 | $21,810 | $137,154 |
| 2020 | $3,143 | $146,895 | $21,810 | $125,085 |
| 2019 | $3,103 | $141,923 | $14,540 | $127,383 |
| 2018 | $2,934 | $134,883 | $14,540 | $120,343 |
| 2017 | $2,880 | $134,883 | $14,540 | $120,343 |
| 2016 | $2,782 | $130,288 | $14,540 | $115,748 |
| 2015 | $2,433 | $129,490 | $14,540 | $114,950 |
| 2014 | $2,433 | $125,480 | $14,540 | $110,940 |
Source: Public Records
Map
Nearby Homes
- 3913 Belle Mere St
- 2527 Westminster Dr
- 2613 Chelsea Dr
- 3950 Hanover Place
- 3962 Hanover Place
- 4021 Hanover Place
- 4025 Hanover Place
- 4029 Hanover Place
- 4024 Hanover Place
- 4037 Hanover Place
- 2216 Gish Ln
- 3108 Williamsburg Cir
- 3109 Campus Cir
- 3205 Timberlane Dr
- 10130 State Highway 64 E
- 8226 County Road 219
- 2902 Shenandoah Dr
- 2033 Old Omen Rd
- 3020 Meadowlark Ln
- 3027 Brentwood Dr
- 3902 Lexington Dr
- 3848 3848 Lexington Dr
- 2614 Lexington Dr
- 3848 Lexington Dr
- 2605 Westminster Dr
- 2605 2605 Westminster
- 2609 Westminster Dr
- 2601 2601 Westminster
- 2601 Westminster Dr
- 2613 2613 Westminster
- 2601/2605 Westminster Dr
- 2535 Westminster Dr
- 3910 3910 Lexington Dr
- 3821 Pine Manor Dr
- 3910 Lexington Dr
- 2617 Westminster Dr
- 3844 Lexington Dr
- 3845 Lexington Dr
- 3845 3845 Lexington
- 3908 3908 Wakefield Dr