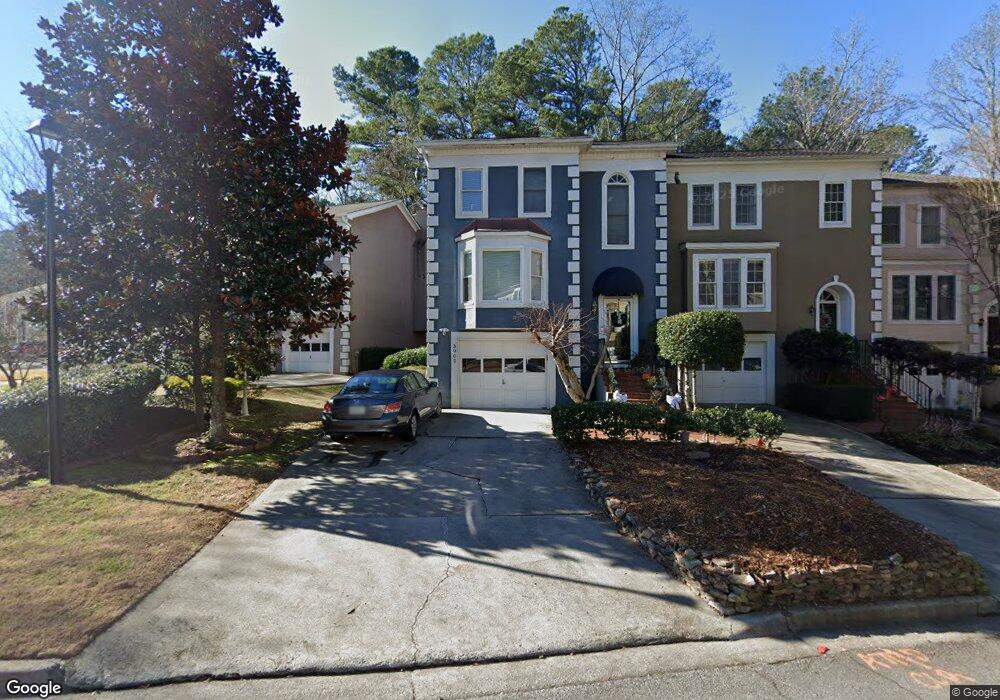
3902 Lodge Alley Unit 3902 Duluth, GA 30096
Estimated Value: $373,000 - $381,103
4
Beds
4
Baths
1,614
Sq Ft
$234/Sq Ft
Est. Value
About This Home
This home is located at 3902 Lodge Alley Unit 3902, Duluth, GA 30096 and is currently estimated at $377,526, approximately $233 per square foot. 3902 Lodge Alley Unit 3902 is a home located in Gwinnett County with nearby schools including Chattahoochee Elementary School, Coleman Middle School, and Duluth High School.
Ownership History
Date
Name
Owned For
Owner Type
Purchase Details
Closed on
Jan 3, 2014
Sold by
Federal Home Loan Mortgage Corporation
Bought by
Mccloud Lavarne E
Current Estimated Value
Home Financials for this Owner
Home Financials are based on the most recent Mortgage that was taken out on this home.
Original Mortgage
$125,190
Outstanding Balance
$92,591
Interest Rate
3.87%
Mortgage Type
FHA
Estimated Equity
$284,935
Purchase Details
Closed on
Dec 18, 2012
Sold by
Diffenderfer Carolyn V
Bought by
Federal Home Loan Mortgage Corporation
Purchase Details
Closed on
Apr 14, 2009
Sold by
Sassman Suzanne M
Bought by
Ball Diane
Home Financials for this Owner
Home Financials are based on the most recent Mortgage that was taken out on this home.
Original Mortgage
$129,600
Interest Rate
5.53%
Mortgage Type
New Conventional
Create a Home Valuation Report for This Property
The Home Valuation Report is an in-depth analysis detailing your home's value as well as a comparison with similar homes in the area
Home Values in the Area
Average Home Value in this Area
Purchase History
| Date | Buyer | Sale Price | Title Company |
|---|---|---|---|
| Mccloud Lavarne E | $127,500 | -- | |
| Federal Home Loan Mortgage Corporation | $124,049 | -- | |
| Ball Diane | $162,000 | -- | |
| Ball Diane V | -- | -- | |
| Sassman Suzanne M | -- | -- |
Source: Public Records
Mortgage History
| Date | Status | Borrower | Loan Amount |
|---|---|---|---|
| Open | Mccloud Lavarne E | $125,190 | |
| Previous Owner | Sassman Suzanne M | $129,600 |
Source: Public Records
Tax History Compared to Growth
Tax History
| Year | Tax Paid | Tax Assessment Tax Assessment Total Assessment is a certain percentage of the fair market value that is determined by local assessors to be the total taxable value of land and additions on the property. | Land | Improvement |
|---|---|---|---|---|
| 2024 | $3,419 | $147,080 | $20,000 | $127,080 |
| 2023 | $3,419 | $146,000 | $20,000 | $126,000 |
| 2022 | $3,150 | $133,400 | $18,000 | $115,400 |
| 2021 | $2,559 | $101,440 | $12,800 | $88,640 |
| 2020 | $2,448 | $95,120 | $12,800 | $82,320 |
| 2019 | $3,085 | $95,120 | $12,800 | $82,320 |
| 2018 | $2,120 | $79,560 | $12,800 | $66,760 |
| 2016 | $1,765 | $63,120 | $10,000 | $53,120 |
| 2015 | $1,827 | $51,000 | $10,000 | $41,000 |
| 2014 | $1,435 | $51,000 | $10,000 | $41,000 |
Source: Public Records
Map
Nearby Homes
- 3835 Meeting St
- 3793 Meeting St NW
- 3781 Meeting St Unit 4
- 3716 Meeting St Unit 1
- 3707 Meeting St
- 3745 Meeting St
- 3659 E Bay St
- 3923 Meeting St
- 3929 Meeting St
- 3629 E Bay St
- 3742 Berkeley Crossing
- 3608 Chattahoochee Ct
- 3752 Berkeley Crossing
- 3677 Blackshear Ct
- 3620 Darwin Place
- 3889 Sidney Lanier Blvd
- 3591 Gray Place
- 3902 Lodge Alley
- 3902 Lodge Alley Unit 1
- 3904 Lodge Alley Unit 5
- 3821 Meeting St
- 3906 Lodge Alley
- 3823 Meeting St Unit 3823
- 3823 Meeting St
- 3823 Meeting St
- 3823 Meeting St NW Unit 3823
- 3908 Lodge Alley NW
- 3908 Lodge Alley
- 3825 Meeting St
- 3825 Meeting St Unit 3825
- 0 Lodge Alley NW Unit 7079368
- 0 Lodge Alley NW Unit 7144899
- 0 Lodge Alley NW Unit 8702791
- 0 Lodge Alley NW Unit 8697651
- 0 Lodge Alley NW Unit 8267057
- 0 Lodge Alley NW Unit 7488109
- 0 Lodge Alley NW