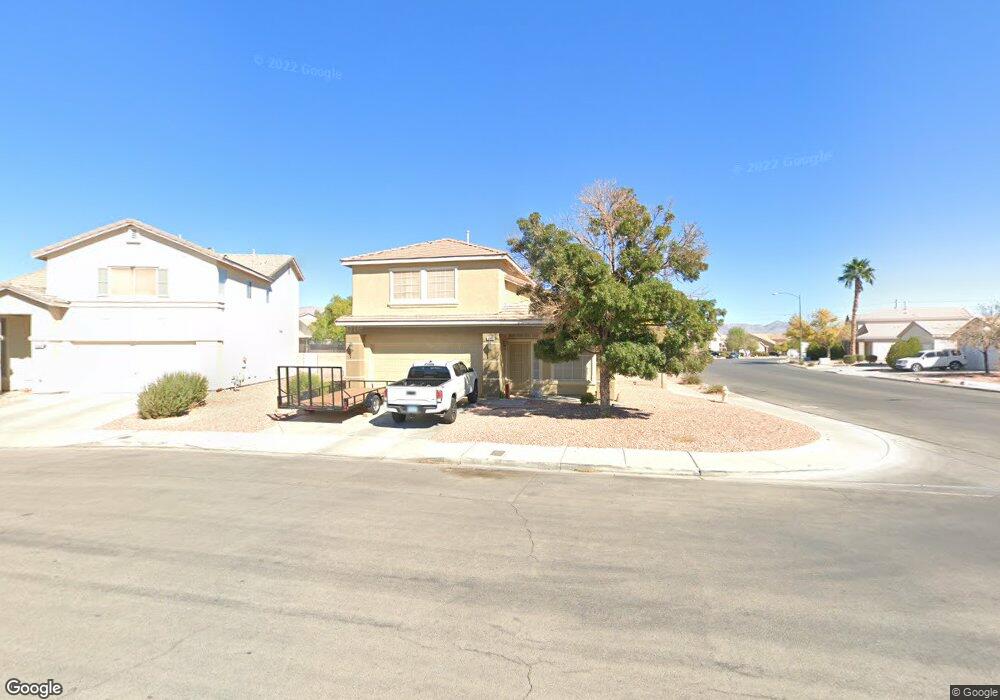
3902 Passing Storm Ln North Las Vegas, NV 89031
Craig Ranch NeighborhoodEstimated Value: $394,127 - $435,000
3
Beds
3
Baths
1,650
Sq Ft
$253/Sq Ft
Est. Value
About This Home
This home is located at 3902 Passing Storm Ln, North Las Vegas, NV 89031 and is currently estimated at $417,782, approximately $253 per square foot. 3902 Passing Storm Ln is a home located in Clark County with nearby schools including Goynes Elementary School, Brian & Teri Cram Middle School, and Shadow Ridge High School.
Ownership History
Date
Name
Owned For
Owner Type
Purchase Details
Closed on
Jan 31, 2022
Sold by
Holmstead and Tayna
Bought by
Sfr Jv-2 Property Llc
Current Estimated Value
Purchase Details
Closed on
Jan 26, 2022
Sold by
Holmstead and Tayna
Bought by
Sfr Jv-2 Property Llc
Purchase Details
Closed on
Oct 4, 2012
Sold by
Holmstead Tayna
Bought by
Holmstead Blake
Home Financials for this Owner
Home Financials are based on the most recent Mortgage that was taken out on this home.
Original Mortgage
$68,640
Interest Rate
3.58%
Mortgage Type
New Conventional
Purchase Details
Closed on
Jun 22, 2007
Sold by
Tracy Keiko
Bought by
Tracy Roger J
Purchase Details
Closed on
Aug 20, 2001
Sold by
Hh Res Llc
Bought by
Tracy Roger J and Tracy Keiko
Home Financials for this Owner
Home Financials are based on the most recent Mortgage that was taken out on this home.
Original Mortgage
$138,395
Interest Rate
7.19%
Mortgage Type
FHA
Create a Home Valuation Report for This Property
The Home Valuation Report is an in-depth analysis detailing your home's value as well as a comparison with similar homes in the area
Home Values in the Area
Average Home Value in this Area
Purchase History
| Date | Buyer | Sale Price | Title Company |
|---|---|---|---|
| Sfr Jv-2 Property Llc | $389,000 | Os National | |
| Sfr Jv-2 Property Llc | $389,000 | Os National | |
| Holmstead Blake | -- | Chicago Title Las Veags | |
| Holmstead Blake | $85,800 | None Available | |
| Tracy Roger J | -- | None Available | |
| Tracy Roger J | $140,896 | United Title |
Source: Public Records
Mortgage History
| Date | Status | Borrower | Loan Amount |
|---|---|---|---|
| Previous Owner | Holmstead Blake | $68,640 | |
| Previous Owner | Tracy Roger J | $138,395 |
Source: Public Records
Tax History Compared to Growth
Tax History
| Year | Tax Paid | Tax Assessment Tax Assessment Total Assessment is a certain percentage of the fair market value that is determined by local assessors to be the total taxable value of land and additions on the property. | Land | Improvement |
|---|---|---|---|---|
| 2025 | $1,817 | $97,284 | $33,250 | $64,034 |
| 2024 | $1,683 | $97,284 | $33,250 | $64,034 |
| 2023 | $1,683 | $90,703 | $30,100 | $60,603 |
| 2022 | $1,558 | $80,941 | $25,550 | $55,391 |
| 2021 | $1,443 | $75,475 | $22,750 | $52,725 |
| 2020 | $1,337 | $73,940 | $21,700 | $52,240 |
| 2019 | $1,249 | $70,204 | $18,900 | $51,304 |
| 2018 | $1,192 | $63,856 | $14,700 | $49,156 |
| 2017 | $2,050 | $61,099 | $13,300 | $47,799 |
| 2016 | $1,116 | $51,034 | $8,750 | $42,284 |
| 2015 | $1,113 | $39,380 | $7,000 | $32,380 |
| 2014 | $1,079 | $31,199 | $7,000 | $24,199 |
Source: Public Records
Map
Nearby Homes
- 6314 Ruby Cedar Ct
- 4025 Fairywren Dr
- 6334 Orions Belt Peak St
- 6103 Harvest Dance St
- 6314 Shadow Moon Place
- 4050 Midnight Crest Ave
- 6223 Orions Belt Peak St
- 3605 Sapphire Sea Ct
- 4145 Midnight Crest Ave
- 3821 Champagne Wood Dr
- 3517 Amish Ave
- 6133 Turaco St
- 3604 Sandy Brown Ave
- 3513 Mastercraft Ave
- 3729 Shimmering Creek Ave
- 5923 Sunrise Creek St
- 6032 Glitter Gold Ct
- 3509 Red Fire Ave
- 6437 Boatbill St
- 4233 Buteo Ln
- 3906 Passing Storm Ln Unit 2
- 6215 Highland Gardens Dr
- 3910 Passing Storm Ln
- 6219 Highland Gardens Dr Unit 5
- 6210 Highland Gardens Dr Unit 2
- 6201 Highland Gardens Dr
- 6214 Highland Gardens Dr
- 6206 Highland Gardens Dr
- 6227 Morning Roses Dr Unit 7
- 3914 Passing Storm Ln Unit 2
- 6218 Highland Gardens Dr
- 6202 Highland Gardens Dr Unit 2
- 6204 Cotinga St
- 6166 Highland Gardens Dr
- 3913 Aracari Dr
- 3918 Passing Storm Ln
- 6222 Highland Gardens Dr
- 6161 Highland Gardens Dr
- 6201 Morning Wing Dr
- 3921 Passing Storm Ln