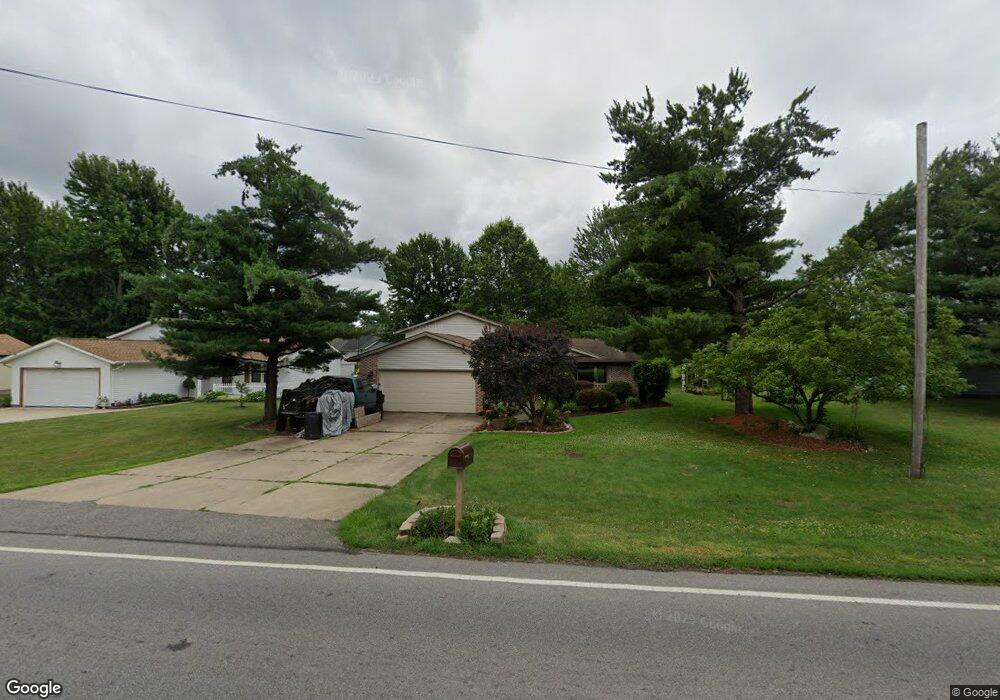
39023 Chestnut Ridge Rd Elyria, OH 44035
Estimated Value: $232,079 - $288,000
3
Beds
2
Baths
1,732
Sq Ft
$151/Sq Ft
Est. Value
About This Home
This home is located at 39023 Chestnut Ridge Rd, Elyria, OH 44035 and is currently estimated at $261,520, approximately $150 per square foot. 39023 Chestnut Ridge Rd is a home located in Lorain County with nearby schools including Midview West Elementary School, Midview North Elementary School, and Midview Middle School.
Ownership History
Date
Name
Owned For
Owner Type
Purchase Details
Closed on
Jan 4, 2005
Sold by
Degeeter Pamela A
Bought by
Scott Sheryl R
Current Estimated Value
Home Financials for this Owner
Home Financials are based on the most recent Mortgage that was taken out on this home.
Original Mortgage
$107,200
Outstanding Balance
$54,231
Interest Rate
5.78%
Mortgage Type
Purchase Money Mortgage
Estimated Equity
$207,289
Purchase Details
Closed on
May 20, 2004
Sold by
Roth Albert W and Roth Glenda Joy
Bought by
Roth Albert and The Albert Roth Trust Agreement
Purchase Details
Closed on
Nov 5, 1999
Sold by
Marie Stoffan Roth Michele and Stoffan Michelle Marie
Bought by
Roth Albert W
Home Financials for this Owner
Home Financials are based on the most recent Mortgage that was taken out on this home.
Original Mortgage
$90,000
Interest Rate
8.02%
Mortgage Type
Credit Line Revolving
Create a Home Valuation Report for This Property
The Home Valuation Report is an in-depth analysis detailing your home's value as well as a comparison with similar homes in the area
Home Values in the Area
Average Home Value in this Area
Purchase History
| Date | Buyer | Sale Price | Title Company |
|---|---|---|---|
| Scott Sheryl R | $134,000 | -- | |
| Roth Albert | -- | -- | |
| Roth Albert W | -- | Lorain County Title Co Inc |
Source: Public Records
Mortgage History
| Date | Status | Borrower | Loan Amount |
|---|---|---|---|
| Open | Scott Sheryl R | $107,200 | |
| Previous Owner | Roth Albert W | $90,000 |
Source: Public Records
Tax History
| Year | Tax Paid | Tax Assessment Tax Assessment Total Assessment is a certain percentage of the fair market value that is determined by local assessors to be the total taxable value of land and additions on the property. | Land | Improvement |
|---|---|---|---|---|
| 2024 | $2,817 | $65,832 | $15,582 | $50,250 |
| 2023 | $1,950 | $41,384 | $8,180 | $33,205 |
| 2022 | $1,937 | $41,384 | $8,180 | $33,205 |
| 2021 | $1,934 | $41,384 | $8,180 | $33,205 |
| 2020 | $1,842 | $36,140 | $7,140 | $29,000 |
| 2019 | $1,786 | $36,140 | $7,140 | $29,000 |
| 2018 | $1,845 | $36,140 | $7,140 | $29,000 |
| 2017 | $1,883 | $34,180 | $7,360 | $26,820 |
| 2016 | $1,849 | $34,180 | $7,360 | $26,820 |
| 2015 | $1,860 | $34,180 | $7,360 | $26,820 |
| 2014 | $1,838 | $33,180 | $7,140 | $26,040 |
| 2013 | $1,895 | $33,180 | $7,140 | $26,040 |
Source: Public Records
Map
Nearby Homes
- 475 Carol Ln
- 121 Oakley Green Dr Unit 13
- 124 Oakley Green Dr
- 348 Pemberton Dr
- 418 Carol Ln
- 134 California Ave
- 239 Syracuse Ct
- 459 Auburn St
- 217 Syracuse Ct
- 715 Carol Ln
- 128 Richmond Ct
- 134 Richmond Ct
- 10488 Dewhurst Rd
- 9929 E River Rd
- 38227 Chestnut Ridge Rd
- 154 Bentley Dr
- 346 Lily Ln
- 349 Lily Ln
- 367 Lily Ln
- 106 Stonecrest Trail
- 39021 Chestnut Ridge Rd
- 39049 Chestnut Ridge Rd
- 116 Victoria Ct
- 39009 Chestnut Ridge Rd
- 39020 Chestnut Ridge Rd
- 107 Victoria Ct
- 39042 Chestnut Ridge Rd
- 38965 Chestnut Ridge Rd
- 108 Victoria Ct
- 1843 Abbe Rd S
- 39070 Chestnut Ridge Rd
- 113 Alexis Dr
- 38953 Chestnut Ridge Rd
- 39086 Chestnut Ridge Rd
- 1842 Abbe Rd S
- 1837 Abbe Rd S
- 119 Alexis Dr
- 102 Victoria Ct
- 201 Alexis Dr
- 315 Alexis Dr
Your Personal Tour Guide
Ask me questions while you tour the home.