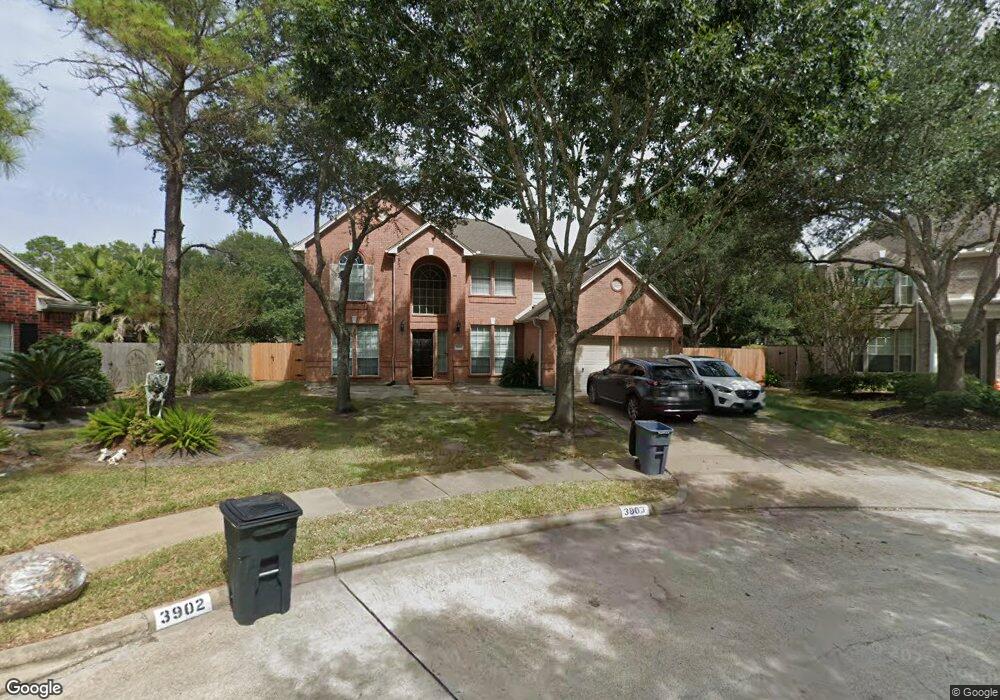
3903 Karrywood Ct Pearland, TX 77584
Silverlake NeighborhoodEstimated Value: $386,000 - $420,000
--
Bed
4
Baths
2,739
Sq Ft
$145/Sq Ft
Est. Value
About This Home
This home is located at 3903 Karrywood Ct, Pearland, TX 77584 and is currently estimated at $397,358, approximately $145 per square foot. 3903 Karrywood Ct is a home located in Brazoria County with nearby schools including Massey Ranch Elementary School, Sam Jamison Middle School, and Pearland Junior High School South.
Ownership History
Date
Name
Owned For
Owner Type
Purchase Details
Closed on
Jun 3, 2008
Sold by
Epperson Charles Emmitt and Dang Phuong Denise
Bought by
Jackson Larry D and Jackson Ginger S
Current Estimated Value
Home Financials for this Owner
Home Financials are based on the most recent Mortgage that was taken out on this home.
Original Mortgage
$209,000
Outstanding Balance
$134,252
Interest Rate
6.07%
Mortgage Type
Purchase Money Mortgage
Estimated Equity
$263,106
Purchase Details
Closed on
Apr 22, 1999
Sold by
Gillmer Steven M and Gillmer Penny E
Bought by
Epperson Charles Emmitt and Dang Phuong Denise
Home Financials for this Owner
Home Financials are based on the most recent Mortgage that was taken out on this home.
Original Mortgage
$149,520
Interest Rate
6.99%
Purchase Details
Closed on
Nov 15, 1996
Sold by
Weekley Homes Inc
Bought by
Gillmer Ii Steven M and Gillmer Penny E
Home Financials for this Owner
Home Financials are based on the most recent Mortgage that was taken out on this home.
Original Mortgage
$155,050
Interest Rate
7.84%
Create a Home Valuation Report for This Property
The Home Valuation Report is an in-depth analysis detailing your home's value as well as a comparison with similar homes in the area
Home Values in the Area
Average Home Value in this Area
Purchase History
| Date | Buyer | Sale Price | Title Company |
|---|---|---|---|
| Jackson Larry D | -- | None Available | |
| Epperson Charles Emmitt | -- | Commerce Land Title | |
| Gillmer Ii Steven M | -- | Priority Title |
Source: Public Records
Mortgage History
| Date | Status | Borrower | Loan Amount |
|---|---|---|---|
| Open | Jackson Larry D | $209,000 | |
| Previous Owner | Epperson Charles Emmitt | $149,520 | |
| Previous Owner | Gillmer Ii Steven M | $155,050 |
Source: Public Records
Tax History Compared to Growth
Tax History
| Year | Tax Paid | Tax Assessment Tax Assessment Total Assessment is a certain percentage of the fair market value that is determined by local assessors to be the total taxable value of land and additions on the property. | Land | Improvement |
|---|---|---|---|---|
| 2025 | $4,915 | $385,800 | $81,310 | $304,490 |
| 2023 | $4,915 | $354,663 | $81,310 | $303,890 |
| 2022 | $7,176 | $322,421 | $42,760 | $289,810 |
| 2021 | $7,464 | $293,110 | $38,880 | $254,230 |
| 2020 | $7,114 | $284,580 | $38,880 | $245,700 |
| 2019 | $6,551 | $253,950 | $38,880 | $215,070 |
| 2018 | $6,582 | $253,950 | $38,880 | $215,070 |
| 2017 | $6,906 | $264,700 | $38,880 | $225,820 |
| 2016 | $6,549 | $267,350 | $38,880 | $228,470 |
| 2014 | $5,244 | $212,450 | $38,880 | $173,570 |
Source: Public Records
Map
Nearby Homes
- 3310 E Overdale Dr
- 3615 Rivers Rd
- 0 Bailey Rd Unit 89982715
- 3722 Paigewood Dr
- 3739 Crescent Dr
- 3731 Crescent Dr
- 3606 Miraglen Dr
- 4146 S Webber Dr
- 2923 Elsbury Ln
- 3602 Chesapeake Ct
- 3901 Magnolia Pkwy
- 4026 Bentley Dr
- 18685 Tree Top Ln
- 18660 Tree Top Ln
- 00 Bailey Rd
- 3143 Edgewood Dr
- 3307 Lawson Dr
- 4311 Duesenberg Ct
- 0 Bailey Rd
- 4531 Curry St
- 3907 Karrywood Ct
- 3902 Karrywood Ct
- 4002 Stonehurst Dr
- 3911 Karrywood Ct
- 3906 Karrywood Ct
- 4006 Stonehurst Dr
- 3910 Karrywood Ct
- 3334 Harbrook Dr
- 3339 E Overdale Dr
- 4010 Stonehurst Dr
- 3335 E Overdale Dr
- 3331 E Overdale Dr
- 3914 Karrywood Ct
- 3330 Harbrook Dr
- 3918 Karrywood Ct
- 3403 W Overdale Dr
- 3327 E Overdale Dr
- 3922 Karrywood Ct
- 3335 Harbrook Dr
- 4003 Stonehurst Dr