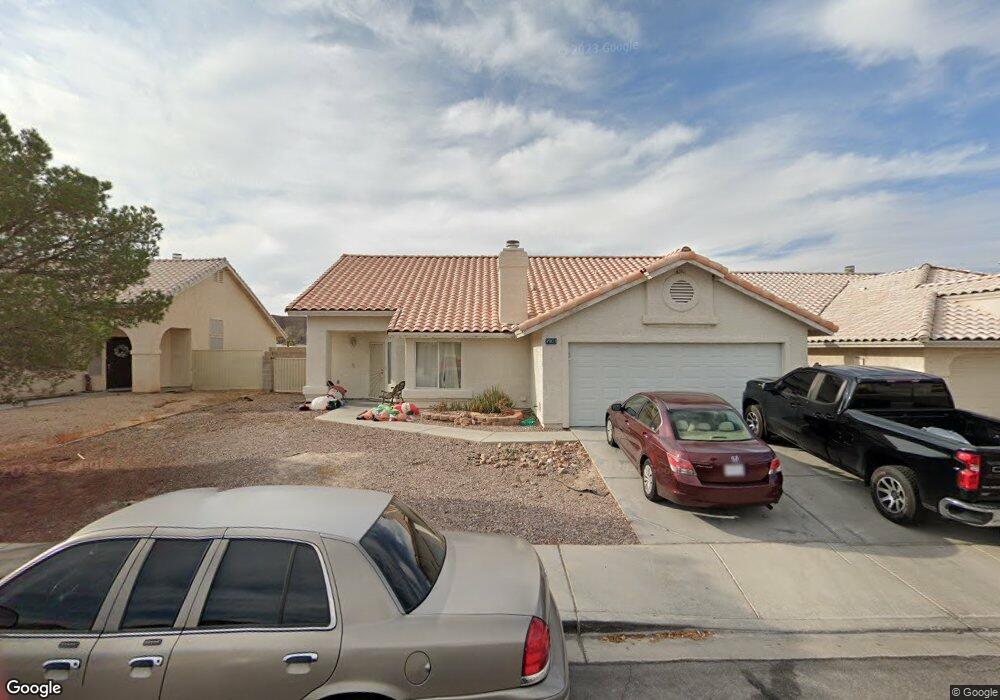
3903 Kohler Way Unit 12D North Las Vegas, NV 89032
Cheyenne NeighborhoodEstimated Value: $403,893 - $447,000
3
Beds
2
Baths
1,802
Sq Ft
$236/Sq Ft
Est. Value
About This Home
This home is located at 3903 Kohler Way Unit 12D, North Las Vegas, NV 89032 and is currently estimated at $424,723, approximately $235 per square foot. 3903 Kohler Way Unit 12D is a home located in Clark County with nearby schools including Lucile Bruner Elementary School, Theron L Swainston Middle School, and Cheyenne High School.
Ownership History
Date
Name
Owned For
Owner Type
Purchase Details
Closed on
Jul 26, 2011
Sold by
Appleton Properties Llc
Bought by
Salas Donna J Iseke and Salas John R
Current Estimated Value
Purchase Details
Closed on
Jul 1, 2011
Sold by
Bigelow Lee A
Bought by
Appleton Properties Llc
Purchase Details
Closed on
Sep 10, 2004
Sold by
Bigelow Lee Alton and Bigelow Hilda Janet
Bought by
Bigelow Lee A
Purchase Details
Closed on
Jun 20, 1996
Sold by
Bigelow Lee A and Bigelow Janet
Bought by
Bigelow Lee Alton and Bigelow Hilda Janet
Purchase Details
Closed on
Nov 12, 1993
Sold by
Sunrise Vista Ii Partnership
Bought by
Bigelow Lee A and Bigelow Janet
Home Financials for this Owner
Home Financials are based on the most recent Mortgage that was taken out on this home.
Original Mortgage
$109,450
Interest Rate
6.85%
Create a Home Valuation Report for This Property
The Home Valuation Report is an in-depth analysis detailing your home's value as well as a comparison with similar homes in the area
Home Values in the Area
Average Home Value in this Area
Purchase History
| Date | Buyer | Sale Price | Title Company |
|---|---|---|---|
| Salas Donna J Iseke | $110,000 | Nevada Title Las Vegas | |
| Appleton Properties Llc | $87,101 | Nevada Title Las Vegas | |
| Bigelow Lee A | -- | Fidelity National Title | |
| Bigelow Lee A | -- | Fidelity National Title | |
| Bigelow Lee Alton | -- | -- | |
| Bigelow Lee A | $115,500 | Land Title |
Source: Public Records
Mortgage History
| Date | Status | Borrower | Loan Amount |
|---|---|---|---|
| Previous Owner | Bigelow Lee A | $109,450 |
Source: Public Records
Tax History Compared to Growth
Tax History
| Year | Tax Paid | Tax Assessment Tax Assessment Total Assessment is a certain percentage of the fair market value that is determined by local assessors to be the total taxable value of land and additions on the property. | Land | Improvement |
|---|---|---|---|---|
| 2025 | $1,797 | $86,986 | $28,000 | $58,986 |
| 2024 | $1,664 | $86,986 | $28,000 | $58,986 |
| 2023 | $1,664 | $86,674 | $30,450 | $56,224 |
| 2022 | $1,541 | $76,391 | $24,850 | $51,541 |
| 2021 | $1,427 | $70,284 | $21,000 | $49,284 |
| 2020 | $1,322 | $70,097 | $21,000 | $49,097 |
| 2019 | $1,239 | $66,030 | $17,500 | $48,530 |
| 2018 | $1,183 | $60,020 | $13,300 | $46,720 |
| 2017 | $1,937 | $60,399 | $12,950 | $47,449 |
| 2016 | $1,021 | $54,433 | $10,500 | $43,933 |
| 2015 | $1,019 | $41,026 | $7,000 | $34,026 |
| 2014 | $989 | $31,019 | $5,250 | $25,769 |
Source: Public Records
Map
Nearby Homes
- 3910 Cheryl Clay Way
- 3107 Atwater Dr
- 3505 Benson Ln
- 3629 Newton Falls St Unit 4
- 3609 Simmons St
- 3614 Newton Falls St
- 0 Simmons & Logan Unit 2721829
- 2801 Simmons Creek Ct
- 0 Simmons & Logan 2 Unit 2722091
- 3556 Valley Lily St
- 3548 Valley Lily St
- Bellevue NextGen Plan at Simmance
- Skyland Plan at Simmance
- 0 Simmons & Logan 3 Unit 2722103
- 3809 Alpine Track Ave
- 3820 Alpine Track Ave
- 3784 Nerine Pass Way
- 2409 W Gilmore Ave
- 3524 Simmons St
- 2906 Carothers Ct
- 3843 Kohler Way
- 3907 Kohler Way
- 3839 Kohler Way
- 3911 Kohler Way
- 3904 Kohler Way
- 3844 Kohler Way
- 3908 Kohler Way
- 3906 Cheryl Clay Way
- 3840 Kohler Way
- 3915 Kohler Way
- 3835 Kohler Way
- 3912 Kohler Way
- 3836 Kohler Way
- 3916 Kohler Way
- 3831 Kohler Way
- 3917 Wabash Ln
- 3919 Kohler Way
- 3913 Wabash Ln Unit 12B
- 3921 Wabash Ln