3903 Monterey Dr Waterloo, IA 50701
Estimated Value: $214,000 - $220,419
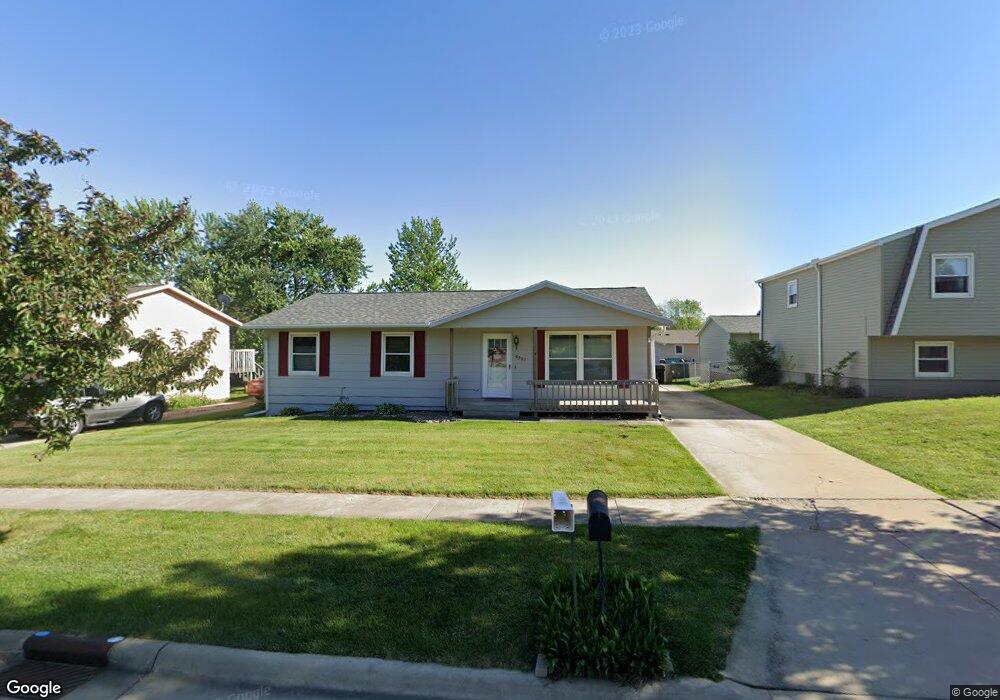
About This Home
This home is located at 3903 Monterey Dr, Waterloo, IA 50701 and is currently estimated at $216,355, approximately $113 per square foot. 3903 Monterey Dr is a home located in Black Hawk County with nearby schools including Becker Elementary School, Central Middle School, and West High School.
Ownership History
We collect this data history from publicly available records. To have your information removed, we recommend requesting removal directly through your county’s website.
Purchase Details
Home Financials for this Owner
Home Financials are based on the most recent Mortgage that was taken out on this home.Purchase History
We collect this data history from publicly available records. To have your information removed, we recommend requesting removal directly through your county’s website.
| Date | Buyer | Sale Price | Title Company |
|---|---|---|---|
| $130,000 | None Available |
Mortgage History
We collect this data history from publicly available records. To have your information removed, we recommend requesting removal directly through your county’s website.
| Date | Status | Borrower | Loan Amount |
|---|---|---|---|
| Open | $104,000 |
Tax History
We collect this data history from publicly available records. To have your information removed, we recommend requesting removal directly through your county’s website.
| Year | Tax Paid | Tax Assessment Tax Assessment Total Assessment is a certain percentage of the fair market value that is determined by local assessors to be the total taxable value of land and additions on the property. | Land | Improvement |
|---|---|---|---|---|
| 2025 | $3,346 | $195,610 | $24,830 | $170,780 |
| 2024 | $3,346 | $178,200 | $24,830 | $153,370 |
| 2023 | $3,020 | $178,200 | $24,830 | $153,370 |
| 2022 | $2,938 | $146,340 | $24,830 | $121,510 |
| 2021 | $2,800 | $146,340 | $24,830 | $121,510 |
| 2020 | $2,750 | $132,220 | $19,310 | $112,910 |
| 2019 | $2,750 | $132,220 | $19,310 | $112,910 |
| 2018 | $2,754 | $132,220 | $19,310 | $112,910 |
| 2017 | $2,840 | $132,220 | $19,310 | $112,910 |
| 2016 | $2,802 | $132,220 | $19,310 | $112,910 |
| 2015 | $2,802 | $132,220 | $19,310 | $112,910 |
| 2014 | $2,732 | $126,840 | $19,310 | $107,530 |
Map
- 3923 Del Matro Rd
- 1516 Aspen Dr
- 4108 Mark Dr Unit Lot 20
- 4126 Mark Dr Unit Lot 23
- 4114 Mark Dr Unit Lot 21
- 4102 Mark Dr Unit Lot 19
- 1414 Ingersoll Rd
- 4628 Luke St Unit Lot 11
- 4419 Luke St Unit Lot 30
- 4719 Luke St Unit Lot 41
- 4708 Luke St Unit Lot 10
- 4513 Luke St Unit Lot 24
- 4523 Luke St Unit Lot 34
- 4625 Luke St Unit Lot 12
- 4907 Luke St
- 4034 Jodi Dr
- 3119 Sager Ave Unit Lot 26
- 0 Cedar Heights Dr Unit NBR20262527
- 12 Acres Cedar Heights Dr
- Lot 9 Greenhill Cir Unit Lot 9 Midway Busines
- 3931 Del Matro Rd
- 3920 Monterey Dr
- 3914 Monterey Dr
- 3928 Monterey Dr
- 3922 Del Matro Rd
- 3930 Del Matro Rd
- 3914 Del Matro Rd
- 1308 Fleur Dr
- 3906 Monterey Dr
- 4102 Aspen Ct
- 1308 Aspen Dr
- 1306 Aspen Dr
- 4108 Aspen Ct
- 1310 Aspen Dr
- 1312 Aspen Dr Unit 1312
- 1226 Fleur Dr
- 1409 Aspen Dr
- 3923 Monterey Dr
- 3915 Monterey Dr
- 3909 Monterey Dr
Ask me questions while you tour the home.