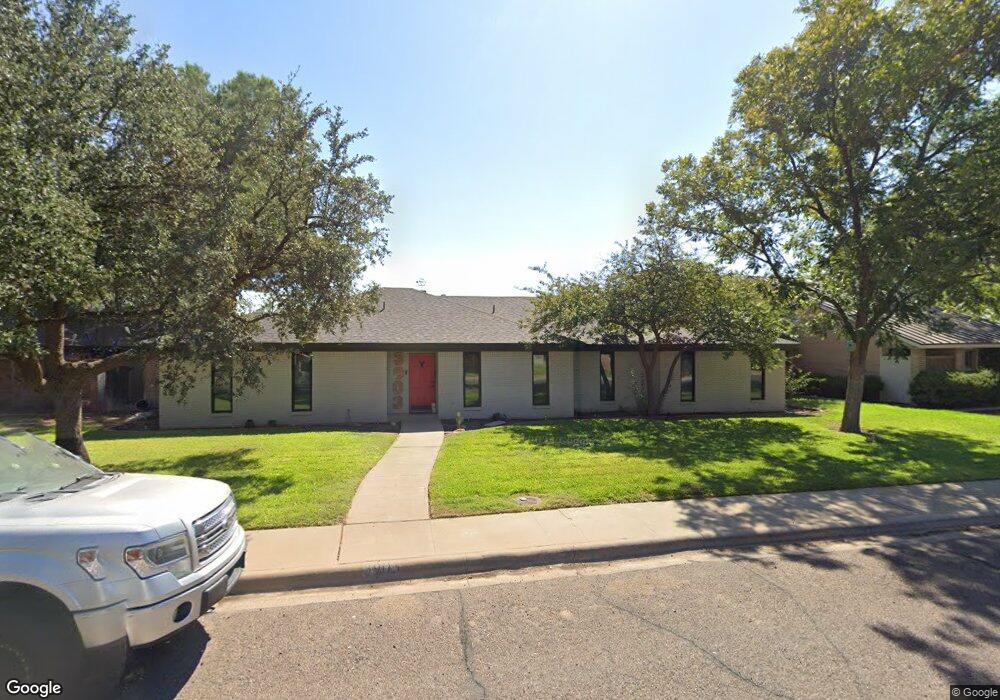
3903 Northfield Ct Midland, TX 79707
Trinity NeighborhoodEstimated Value: $483,000 - $519,000
4
Beds
3
Baths
3,084
Sq Ft
$162/Sq Ft
Est. Value
About This Home
This home is located at 3903 Northfield Ct, Midland, TX 79707 and is currently estimated at $501,067, approximately $162 per square foot. 3903 Northfield Ct is a home located in Midland County with nearby schools including Parker Elementary School, Alamo Junior High School, and Robert H. Goddard Junior High School.
Ownership History
Date
Name
Owned For
Owner Type
Purchase Details
Closed on
Aug 28, 2015
Sold by
Houdyshell Floyd S and Houdyshell Susan J
Bought by
Nedorub Olga I
Current Estimated Value
Home Financials for this Owner
Home Financials are based on the most recent Mortgage that was taken out on this home.
Original Mortgage
$313,500
Outstanding Balance
$246,313
Interest Rate
4.08%
Mortgage Type
New Conventional
Estimated Equity
$254,754
Purchase Details
Closed on
Jun 27, 2000
Sold by
Brady Timothy B
Bought by
Nedorub Olga I
Purchase Details
Closed on
Jun 11, 1997
Bought by
Nedorub Olga I
Purchase Details
Closed on
Jun 1, 1996
Bought by
Nedorub Olga I
Purchase Details
Closed on
Jul 1, 1991
Bought by
Nedorub Olga I
Purchase Details
Closed on
Apr 1, 1987
Bought by
Nedorub Olga I
Purchase Details
Closed on
Jan 1, 1982
Bought by
Nedorub Olga I
Create a Home Valuation Report for This Property
The Home Valuation Report is an in-depth analysis detailing your home's value as well as a comparison with similar homes in the area
Home Values in the Area
Average Home Value in this Area
Purchase History
| Date | Buyer | Sale Price | Title Company |
|---|---|---|---|
| Nedorub Olga I | -- | West Tx Abstract & Title Co | |
| Nedorub Olga I | -- | -- | |
| Nedorub Olga I | -- | -- | |
| Nedorub Olga I | -- | -- | |
| Nedorub Olga I | -- | -- | |
| Nedorub Olga I | -- | -- | |
| Nedorub Olga I | -- | -- |
Source: Public Records
Mortgage History
| Date | Status | Borrower | Loan Amount |
|---|---|---|---|
| Open | Nedorub Olga I | $313,500 |
Source: Public Records
Tax History Compared to Growth
Tax History
| Year | Tax Paid | Tax Assessment Tax Assessment Total Assessment is a certain percentage of the fair market value that is determined by local assessors to be the total taxable value of land and additions on the property. | Land | Improvement |
|---|---|---|---|---|
| 2025 | $5,332 | $429,400 | $33,210 | $396,190 |
| 2024 | $5,341 | $435,770 | $33,210 | $402,560 |
| 2023 | $5,015 | $418,640 | $33,210 | $385,430 |
| 2022 | $6,472 | $414,220 | $33,210 | $381,010 |
| 2021 | $7,216 | $414,220 | $33,210 | $381,010 |
| 2020 | $6,101 | $397,450 | $33,210 | $364,240 |
| 2019 | $7,384 | $390,050 | $33,210 | $364,240 |
| 2018 | $6,894 | $354,590 | $33,210 | $321,380 |
| 2017 | $6,727 | $345,960 | $33,210 | $312,750 |
| 2016 | $6,340 | $325,480 | $33,210 | $292,270 |
| 2015 | -- | $310,200 | $33,210 | $283,040 |
| 2014 | -- | $320,430 | $33,210 | $287,220 |
Source: Public Records
Map
Nearby Homes
- 3901 Arroyo Dr
- 4200 Boulder Dr
- 4003 Compton Dr
- 4303 Arroyo Dr
- 4101 Gleneagles Dr
- 4203 Skyline Dr
- 4207 Merrill Dr
- 4209 Merrill Dr
- 3907 Westminister Dr
- 4313 Valley Dr
- 3400 Salisbury Place
- 3400 Wedgwood St
- 4700 Boulder Dr Unit 710
- 4700 Boulder Dr Unit 611
- 4700 Boulder Dr Unit 103
- 4700 Boulder Dr Unit 303
- 4700 Boulder Dr Unit 1112
- 4700 Boulder Dr Unit 1504
- 4700 Boulder Dr Unit 1605
- 4700 Boulder Dr
- 3905 Northfield Ct
- 3717 Northfield Ct
- 3713 Northfield Ct
- 3901 Northfield Ct
- 3907 Northfield Ct
- 3904 Northfield Ct
- 3906 Northfield Ct
- 3902 Northfield Ct
- 3909 Northfield Ct
- 3807 Northfield Dr
- 3908 Northfield Ct
- 3900 Northfield Ct
- 3508 Northfield Ct
- 3404 Northfield Ct
- 3910 Northfield Ct
- 3911 Northfield Ct
- 3806 Saint Andrews Ct
- 4013 Angelina Dr
- 3900 Godfrey St
- 3804 Saint Andrews Ct