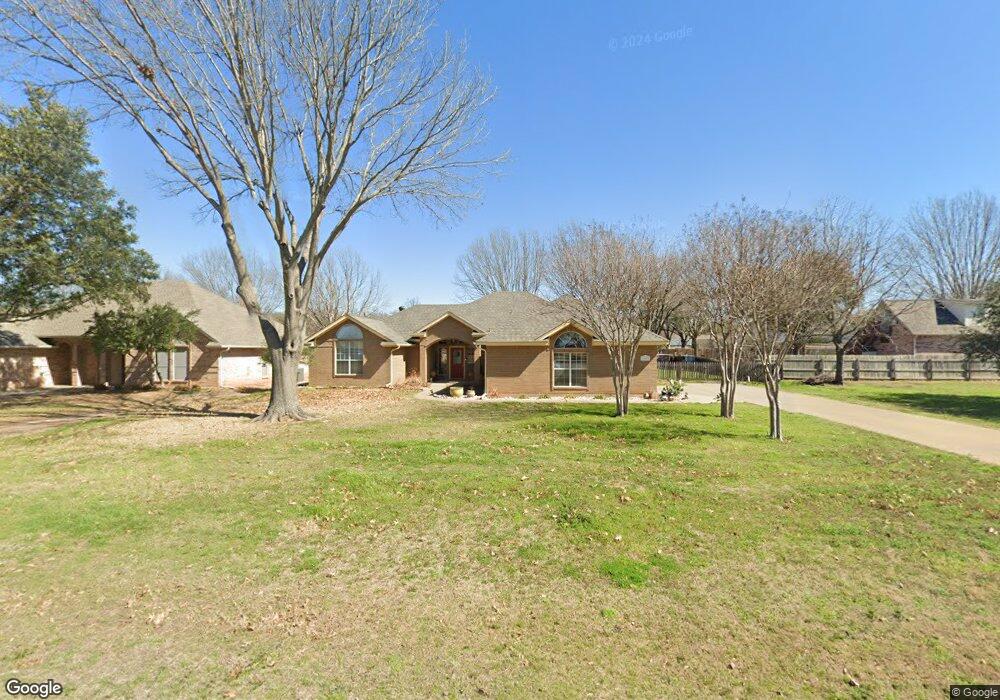
3903 Santa Cruz St Granbury, TX 76049
Estimated Value: $378,414 - $419,000
3
Beds
2
Baths
2,112
Sq Ft
$190/Sq Ft
Est. Value
About This Home
This home is located at 3903 Santa Cruz St, Granbury, TX 76049 and is currently estimated at $401,104, approximately $189 per square foot. 3903 Santa Cruz St is a home located in Hood County with nearby schools including Nettie Baccus Elementary School, Granbury Middle School, and Granbury High School.
Ownership History
Date
Name
Owned For
Owner Type
Purchase Details
Closed on
May 16, 2019
Sold by
Woods Timothy E
Bought by
Timmons Brady L and Timmons Katherine K
Current Estimated Value
Home Financials for this Owner
Home Financials are based on the most recent Mortgage that was taken out on this home.
Original Mortgage
$236,550
Outstanding Balance
$206,687
Interest Rate
4%
Mortgage Type
Commercial
Estimated Equity
$194,417
Purchase Details
Closed on
Feb 22, 2016
Sold by
Woods Mary E and Woods Mary Elizabeth
Bought by
Woods Timothy E
Home Financials for this Owner
Home Financials are based on the most recent Mortgage that was taken out on this home.
Original Mortgage
$75,000
Interest Rate
3.81%
Mortgage Type
Seller Take Back
Purchase Details
Closed on
Mar 22, 1996
Sold by
Woods Timothy and Woods Mary E
Bought by
Woods Timothy E
Purchase Details
Closed on
Jun 7, 1985
Sold by
Laguna Vista Ltd
Bought by
Woods Timothy E
Create a Home Valuation Report for This Property
The Home Valuation Report is an in-depth analysis detailing your home's value as well as a comparison with similar homes in the area
Home Values in the Area
Average Home Value in this Area
Purchase History
| Date | Buyer | Sale Price | Title Company |
|---|---|---|---|
| Timmons Brady L | -- | None Available | |
| Woods Timothy E | -- | Central Texas Title | |
| Woods Timothy E | -- | -- | |
| Woods Timothy E | -- | -- |
Source: Public Records
Mortgage History
| Date | Status | Borrower | Loan Amount |
|---|---|---|---|
| Open | Timmons Brady L | $236,550 | |
| Previous Owner | Woods Timothy E | $75,000 |
Source: Public Records
Tax History Compared to Growth
Tax History
| Year | Tax Paid | Tax Assessment Tax Assessment Total Assessment is a certain percentage of the fair market value that is determined by local assessors to be the total taxable value of land and additions on the property. | Land | Improvement |
|---|---|---|---|---|
| 2025 | $3,287 | $365,830 | $25,000 | $340,830 |
| 2024 | $3,344 | $358,875 | $25,000 | $348,850 |
| 2023 | $3,035 | $377,860 | $25,000 | $352,860 |
| 2022 | $3,546 | $390,290 | $20,000 | $370,290 |
| 2021 | $4,139 | $275,450 | $20,000 | $255,450 |
| 2020 | $3,807 | $245,120 | $20,000 | $225,120 |
| 2019 | $3,617 | $222,510 | $20,000 | $202,510 |
| 2018 | $3,385 | $208,190 | $20,000 | $188,190 |
| 2017 | $3,212 | $192,080 | $20,000 | $172,080 |
| 2016 | $2,982 | $178,310 | $20,000 | $158,310 |
| 2015 | $2,655 | $171,790 | $20,000 | $151,790 |
| 2014 | $2,655 | $171,790 | $20,000 | $151,790 |
Source: Public Records
Map
Nearby Homes
- 808 Flamingo Rd
- 3805 Aqua Vista Ct
- 1005 Whippoorwill Dr
- 4701 Albatross Dr
- 3905 Bonita Ct
- 605 Killough Rd Unit LOT 1
- 605 Killough Rd
- 3328 Abes Landing Ct
- 3309 Ferry Boat Ln
- 3449 Abes Landing Dr
- 337 Paddle Boat Dr
- 388 Paddle Boat Dr
- 3221 Boat Landing Trail
- 303 Bowrider Ln
- Rose III Plan at Abe’s Landing - Abe's Landing
- Dewberry Plan at El Dorado
- Bellflower III Plan at Abe’s Landing - Abe's Landing
- Dewberry II Plan at El Dorado
- Carolina III Plan at El Dorado
- Violet IV Plan at Abe’s Landing - Abe's Landing
- 3905 Santa Cruz St
- 606 Aqua Vista Dr
- 604 Aqua Vista Dr
- 3902 Monterrey Dr
- 3907 Santa Cruz St
- 602 Aqua Vista Dr
- 3904 Monterrey Dr
- 3902 Santa Cruz St
- 610 Aqua Vista Dr
- 3904 Santa Cruz St
- 3906 Monterrey Dr
- 600 Aqua Vista Dr
- 3906 Santa Cruz St
- 612 Aqua Vista Dr
- 4009 Monterrey Dr
- 4007 Monterrey Dr
- 607 Aqua Vista Dr
- 605 Aqua Vista Dr
- 4011 Monterrey Dr
- 614 Aqua Vista Dr