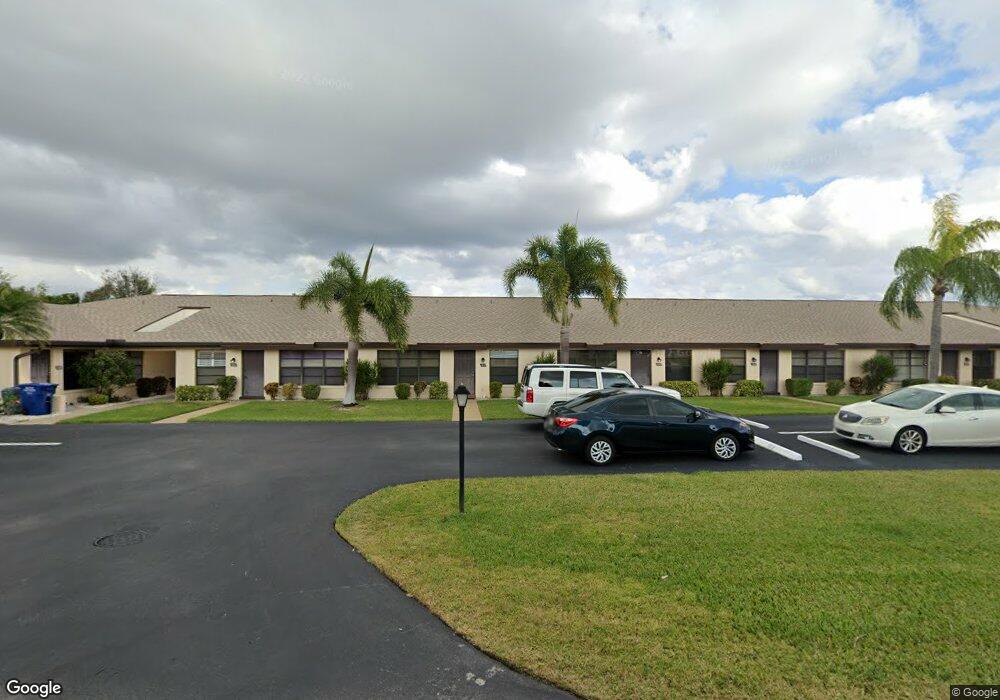
3903 SE 11th Ave Unit 103 Cape Coral, FL 33904
Bimini Basin NeighborhoodEstimated Value: $127,997 - $156,000
2
Beds
2
Baths
794
Sq Ft
$182/Sq Ft
Est. Value
About This Home
This home is located at 3903 SE 11th Ave Unit 103, Cape Coral, FL 33904 and is currently estimated at $144,749, approximately $182 per square foot. 3903 SE 11th Ave Unit 103 is a home located in Lee County with nearby schools including Cape Elementary School, Caloosa Elementary School, and Tropic Isles Elementary School.
Ownership History
Date
Name
Owned For
Owner Type
Purchase Details
Closed on
Dec 18, 2015
Sold by
Santospirito Barry and Santospirito Michael
Bought by
Mattia Regina
Current Estimated Value
Home Financials for this Owner
Home Financials are based on the most recent Mortgage that was taken out on this home.
Original Mortgage
$55,500
Outstanding Balance
$44,022
Interest Rate
3.96%
Mortgage Type
New Conventional
Estimated Equity
$100,727
Purchase Details
Closed on
Sep 10, 2004
Sold by
Perry Helen L and Schivinski Phyllis
Bought by
Santospirito Barry and Santospirito Michael
Home Financials for this Owner
Home Financials are based on the most recent Mortgage that was taken out on this home.
Original Mortgage
$77,600
Interest Rate
5.73%
Mortgage Type
Unknown
Purchase Details
Closed on
Jul 1, 1999
Sold by
Smith Winifred E
Bought by
Schivinski Phyllis and Perry Helen L
Create a Home Valuation Report for This Property
The Home Valuation Report is an in-depth analysis detailing your home's value as well as a comparison with similar homes in the area
Home Values in the Area
Average Home Value in this Area
Purchase History
| Date | Buyer | Sale Price | Title Company |
|---|---|---|---|
| Mattia Regina | $74,000 | Heights Title Services Llc | |
| Santospirito Barry | $97,000 | Team Title Insurance Inc | |
| Schivinski Phyllis | $54,000 | -- |
Source: Public Records
Mortgage History
| Date | Status | Borrower | Loan Amount |
|---|---|---|---|
| Open | Mattia Regina | $55,500 | |
| Previous Owner | Santospirito Barry | $77,600 |
Source: Public Records
Tax History Compared to Growth
Tax History
| Year | Tax Paid | Tax Assessment Tax Assessment Total Assessment is a certain percentage of the fair market value that is determined by local assessors to be the total taxable value of land and additions on the property. | Land | Improvement |
|---|---|---|---|---|
| 2025 | $978 | $74,860 | -- | -- |
| 2024 | $987 | $72,750 | -- | -- |
| 2023 | $987 | $70,631 | $0 | $0 |
| 2022 | $865 | $68,574 | $0 | $0 |
| 2021 | $854 | $78,360 | $0 | $78,360 |
| 2020 | $828 | $65,658 | $0 | $0 |
| 2019 | $811 | $64,182 | $0 | $0 |
| 2018 | $801 | $62,985 | $0 | $62,985 |
| 2017 | $822 | $66,215 | $0 | $66,215 |
| 2016 | $1,311 | $57,183 | $0 | $57,183 |
| 2015 | $1,102 | $47,800 | $0 | $47,800 |
| 2014 | -- | $46,200 | $0 | $46,200 |
| 2013 | -- | $44,600 | $0 | $44,600 |
Source: Public Records
Map
Nearby Homes
- 3913 SE 11th Ave Unit 206
- 3916 SE 11th Place Unit 503
- 3911 Country Club Blvd Unit 102
- 4547 SE 11th Place
- 3808 SE 11th Ave
- 1102 SE 39th Terrace Unit 108
- 1011 SE 38th Terrace Unit 2213
- 1107 SE 38th St
- 1105 SE 38th St
- 1101 SE 38th St
- 3803 SE 11th Place Unit 1210
- 1005 SE 40th St Unit 5
- 1005 SE 40th St Unit 4
- 1237 SE 40th St
- 3914 SE 12th Ave
- 3810 SE 12th Place
- 3824 SE 10th Place
- 1131 SE 38th St
- 4012 Country Club Blvd
- 3714 SE 12th Ave Unit 201A
- 3903 SE 11th Ave Unit 107
- 3903 SE 11th Ave Unit 109
- 3903 SE 11th Ave Unit 108
- 3903 SE 11th Ave Unit 102
- 3903 SE 11th Ave Unit 105
- 3903 SE 11th Ave Unit 104
- 3903 SE 11th Ave Unit 101
- 3903 SE 11th Ave Unit 106
- 3906 SE 11th Place Unit 603
- 3906 SE 11th Place Unit 605
- 3906 SE 11th Place Unit 606
- 3906 SE 11th Place Unit 604
- 3906 SE 11th Place Unit 607
- 3906 SE 11th Place Unit 602
- 3906 SE 11th Place Unit 601
- 3902 SE 11th Ave
- 3902 SE 11th Ave
- 3904 SE 11th Ave
- 3834 SE 11th Place Unit 701
- 3834 SE 11th Place Unit 702