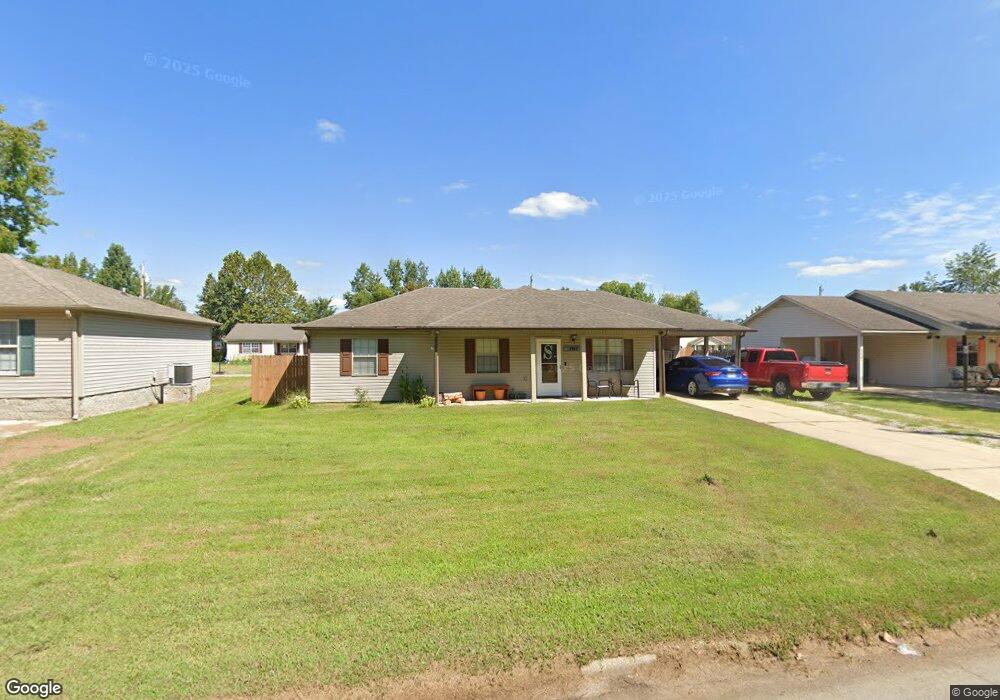
3903 Shelby Dr Paragould, AR 72450
Estimated Value: $137,679 - $152,000
--
Bed
2
Baths
1,184
Sq Ft
$123/Sq Ft
Est. Value
About This Home
This home is located at 3903 Shelby Dr, Paragould, AR 72450 and is currently estimated at $145,920, approximately $123 per square foot. 3903 Shelby Dr is a home located in Greene County with nearby schools including Greene County Tech Primary School, Greene County Tech Elementary School, and Greene County Tech Intermediate School.
Ownership History
Date
Name
Owned For
Owner Type
Purchase Details
Closed on
Jan 22, 2021
Sold by
Smith Tara and Estate Of Mary K Despain
Bought by
Swain Gregory and Rock Rosa
Current Estimated Value
Home Financials for this Owner
Home Financials are based on the most recent Mortgage that was taken out on this home.
Original Mortgage
$114,389
Outstanding Balance
$101,859
Interest Rate
2.71%
Mortgage Type
FHA
Estimated Equity
$44,061
Purchase Details
Closed on
May 28, 2009
Sold by
Smith Shirley
Bought by
Despain Mary
Home Financials for this Owner
Home Financials are based on the most recent Mortgage that was taken out on this home.
Original Mortgage
$66,283
Interest Rate
4.72%
Mortgage Type
New Conventional
Purchase Details
Closed on
Apr 10, 2002
Bought by
Smith
Purchase Details
Closed on
May 8, 2001
Bought by
Wilkinson
Purchase Details
Closed on
Mar 28, 2001
Bought by
King
Create a Home Valuation Report for This Property
The Home Valuation Report is an in-depth analysis detailing your home's value as well as a comparison with similar homes in the area
Home Values in the Area
Average Home Value in this Area
Purchase History
| Date | Buyer | Sale Price | Title Company |
|---|---|---|---|
| Swain Gregory | $116,500 | None Available | |
| Despain Mary | $31,000 | None Available | |
| Smith | $68,000 | -- | |
| Wilkinson | -- | -- | |
| King | -- | -- |
Source: Public Records
Mortgage History
| Date | Status | Borrower | Loan Amount |
|---|---|---|---|
| Open | Swain Gregory | $114,389 | |
| Previous Owner | Despain Mary | $66,283 |
Source: Public Records
Tax History Compared to Growth
Tax History
| Year | Tax Paid | Tax Assessment Tax Assessment Total Assessment is a certain percentage of the fair market value that is determined by local assessors to be the total taxable value of land and additions on the property. | Land | Improvement |
|---|---|---|---|---|
| 2025 | $933 | $24,840 | $3,300 | $21,540 |
| 2024 | $892 | $24,840 | $3,300 | $21,540 |
| 2023 | $834 | $18,170 | $2,800 | $15,370 |
| 2022 | $459 | $18,170 | $2,800 | $15,370 |
| 2021 | $350 | $18,170 | $2,800 | $15,370 |
| 2020 | $691 | $15,180 | $2,800 | $12,380 |
| 2019 | $288 | $15,180 | $2,800 | $12,380 |
| 2018 | $286 | $15,180 | $2,800 | $12,380 |
| 2017 | $589 | $15,180 | $2,800 | $12,380 |
| 2016 | $213 | $15,180 | $2,800 | $12,380 |
| 2015 | $186 | $12,050 | $2,700 | $9,350 |
| 2014 | $540 | $12,050 | $2,700 | $9,350 |
Source: Public Records
Map
Nearby Homes
- 0 Mcpherson Ln
- 700 Cedar Ridge Rd
- 4105 Cedar Valley Dr
- 601 N Center Hill Rd
- 202 Foxfire Dr
- 3710 W Kingshighway
- 1 N Rockingchair Rd
- 203 N Rockingchair Rd
- 33 Acres M L Greene 710 Rd
- 4214 W Kingshighway
- 0 N Rockingchair Rd
- 203 Bellwood Dr
- 217 S Center Hill Rd
- 2903 Brookside Cir
- 000 N Rockingchair Rd
- 2820 Brookside Cir
- 402 Bellwood Dr
- 1103 N 29th St
- 4908 W Kingshighway
- 3901 Shelby Dr
- 3905 Shelby Dr
- 3805 Shelby Dr
- 3907 Shelby Dr
- 3901 Emilee Jo Dr
- 3905 Emilee Jo Dr
- 3900 Shelby Dr
- 3904 Shelby Dr
- 3807 Emilee Jo Dr
- 3906 Shelby Dr
- 0 Shelby Dr
- 3803 Shelby Dr
- 3710 Shelby Dr
- 3805 Emilee Jo Dr
- 3802 Shelby Dr
- 3802 Shelby Dr
- 3909 Emilee Jo Dr
- 0 Emilee Jo Dr Unit 15035191
- 0 Emilee Jo Dr Unit 17030959
- 3801 Shelby Dr