Estimated Value: $43,000 - $179,000
--
Bed
1
Bath
670
Sq Ft
$168/Sq Ft
Est. Value
About This Home
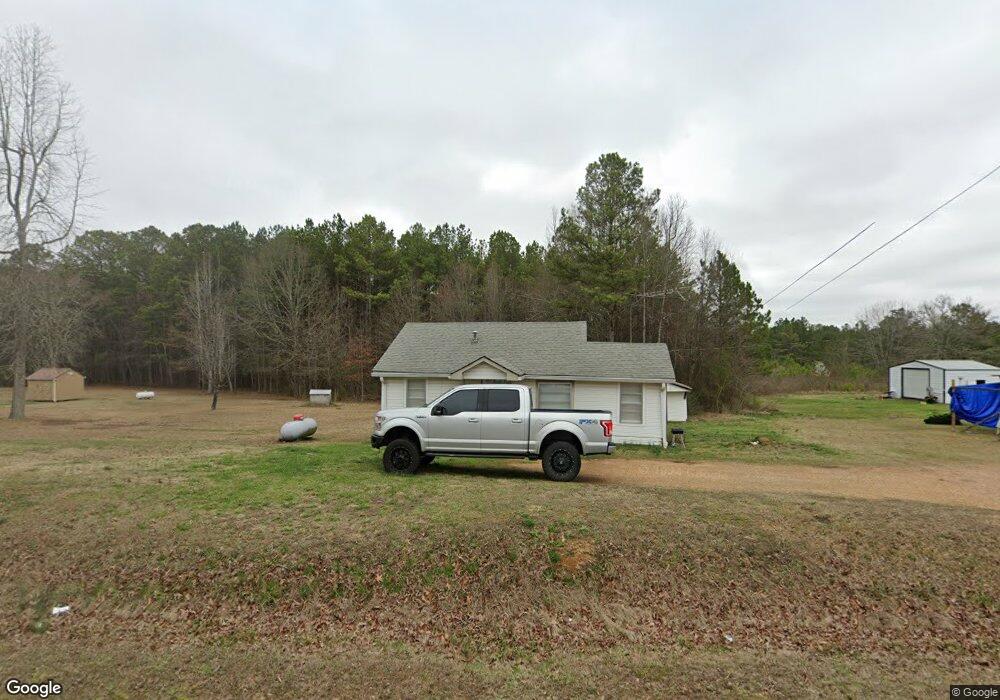
This home is located at 3904 Blacks Bluff Rd SW, Rome, GA 30161 and is currently estimated at $112,508, approximately $167 per square foot. 3904 Blacks Bluff Rd SW is a home located in Floyd County with nearby schools including Coosa Middle School and Coosa High School.
Ownership History
Date
Name
Owned For
Owner Type
Purchase Details
Closed on
Jul 23, 2019
Sold by
Broach Beverly Diane
Bought by
Gregory Eric Scott
Current Estimated Value
Purchase Details
Closed on
Sep 24, 2018
Sold by
Crumley Tommie Intell
Bought by
Dowdy Dusty Joseph and Broach Beverly Diane
Purchase Details
Closed on
Apr 5, 1978
Sold by
Lambert Billy Joe
Bought by
Dowdy Tommie Inell Crumley
Purchase Details
Closed on
Feb 3, 1978
Bought by
P and R
Purchase Details
Closed on
Mar 5, 1976
Sold by
Burk William F
Bought by
Lambert Billy Joe
Purchase Details
Closed on
Dec 30, 1975
Sold by
Floyd Buddy E
Bought by
Burk William F
Purchase Details
Closed on
Jan 21, 1975
Sold by
Gillespie Danny Carl and Ideline Mae
Bought by
Floyd Buddy E
Purchase Details
Closed on
Feb 8, 1974
Sold by
Burk William F
Bought by
Gillespie Danny Carl and Ideline Mae
Purchase Details
Closed on
Mar 29, 1973
Bought by
Burk William F
Create a Home Valuation Report for This Property
The Home Valuation Report is an in-depth analysis detailing your home's value as well as a comparison with similar homes in the area
Purchase History
| Date | Buyer | Sale Price | Title Company |
|---|---|---|---|
| Gregory Eric Scott | $25,000 | -- | |
| Dowdy Dusty Joseph | -- | -- | |
| Broach Beverly Diane | -- | -- | |
| Dowdy Tommie Inell Crumley | $7,700 | -- | |
| P | -- | -- | |
| Lambert Billy Joe | $5,500 | -- | |
| Burk William F | $7,500 | -- | |
| Floyd Buddy E | $7,500 | -- | |
| Gillespie Danny Carl | $7,500 | -- | |
| Burk William F | $4,600 | -- |
Source: Public Records
Tax History
| Year | Tax Paid | Tax Assessment Tax Assessment Total Assessment is a certain percentage of the fair market value that is determined by local assessors to be the total taxable value of land and additions on the property. | Land | Improvement |
|---|---|---|---|---|
| 2025 | $587 | $20,506 | $6,029 | $14,477 |
| 2024 | $587 | $18,592 | $5,359 | $13,233 |
| 2023 | $532 | $17,659 | $4,872 | $12,787 |
| 2022 | $397 | $13,378 | $3,982 | $9,396 |
| 2021 | $342 | $11,319 | $3,630 | $7,689 |
| 2020 | $304 | $10,493 | $3,157 | $7,336 |
| 2019 | $253 | $8,424 | $3,157 | $5,267 |
| 2018 | $34 | $7,911 | $3,006 | $4,905 |
| 2017 | $30 | $7,528 | $2,784 | $4,744 |
| 2016 | $38 | $8,228 | $2,760 | $5,468 |
| 2015 | -- | $8,228 | $2,760 | $5,468 |
| 2014 | -- | $8,228 | $2,760 | $5,468 |
Source: Public Records
Map
Nearby Homes
- 0 Old Blacks Bluff Rd SW Unit 10652523
- 4458 Old Blacks Bluff Rd SW
- 1039 Livingston Rd SW
- 3428 Horseleg Creek Rd SW
- 0 Blacks Bluff Rd SW Unit 17015073
- 18 Rosalyn Dr SW
- 10 Susanne Ct SW
- 16 Hadrian Ridge Dr SW
- 675 McGee Bend Rd SW
- 262 Blacks Bluff Rd SW
- 2081 Blacks Bluff Lot A Rd SW
- 2081 Blacks Bluff Rd SW Unit LOT A
- 0 Barker Rd SW Unit 10651788
- 14 Bryan Springs Rd SW
- 48 Highlander Trail SW
- 5981 Blacks Bluff Rd SW
- 1763 Burnett Ferry Rd SW
- 23 Orchard Spring Dr SW
- 1090 Mays Bridge Rd SW
- 1381 Mount Alto Rd SW
- 3888 Blacks Bluff Rd SW
- 3903 Blacks Bluff Rd SW
- 3926 Blacks Bluff Rd SW
- 3887 Blacks Bluff Rd SW
- 0 Cunningham Rd SW Unit 6079614
- 0 Cunningham Rd SW Unit 8461740
- 0 Cunningham Rd SW Unit 5940182
- 0 Cunningham Rd SW Unit 8295930
- 0 Cunningham Rd SW Unit 1,2,3 7038125
- 0 Cunningham Rd SW Unit 7337465
- 0 Cunningham Rd SW Unit 10252851
- 0 Cunningham Rd SW Unit 10248526
- 0 Cunningham Rd SW Unit 7332655
- 0 Cunningham Rd SW Unit 10210437
- 0 Cunningham Rd SW Unit 7285183
- 0 Cunningham Rd SW Unit 20120109
- 0 Cunningham Rd SW Unit 20077658
- 0 Cunningham Rd SW Unit 8051430
- 0 Cunningham Rd SW Unit 4110008
- 0 Cunningham Rd SW Unit 6836063
Your Personal Tour Guide
Ask me questions while you tour the home.