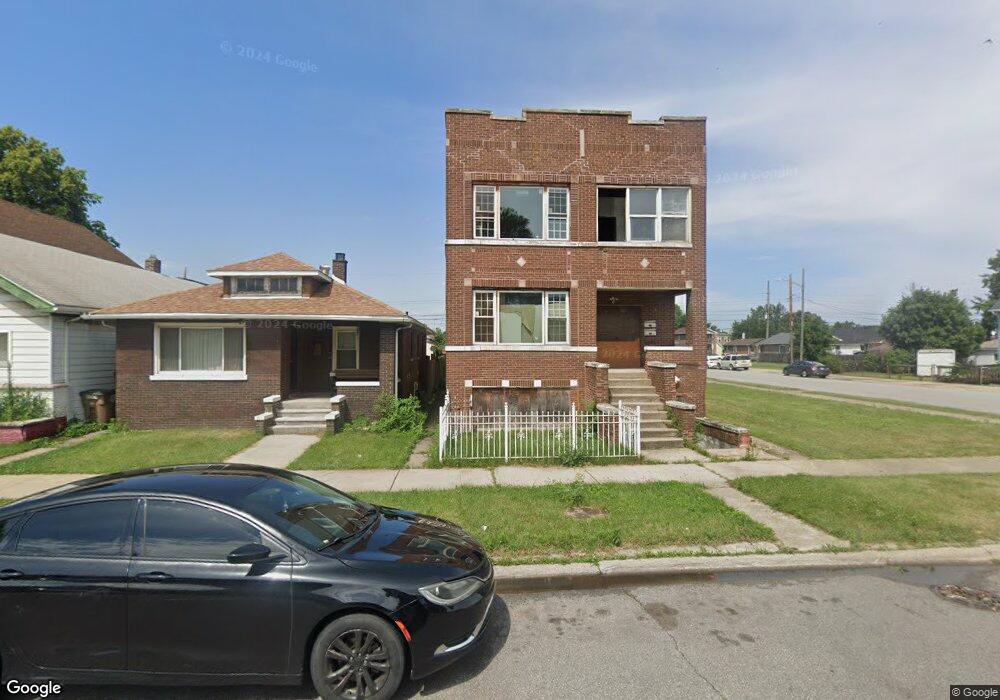
3904 Hemlock St East Chicago, IN 46312
Indiana Harbor NeighborhoodEstimated Value: $267,166
11
Beds
5
Baths
4,560
Sq Ft
$59/Sq Ft
Est. Value
About This Home
This home is located at 3904 Hemlock St, East Chicago, IN 46312 and is currently priced at $267,166, approximately $58 per square foot. 3904 Hemlock St is a home located in Lake County with nearby schools including East Chicago Central High School, East Chicago Lighthouse, and East Chicago Urban Enterprise Academy.
Ownership History
Date
Name
Owned For
Owner Type
Purchase Details
Closed on
May 24, 2022
Sold by
Rehabiah Winston
Bought by
Winston Ashanti
Current Estimated Value
Purchase Details
Closed on
Mar 29, 2022
Sold by
Rehabiah Winston
Bought by
Winston Ashanti
Purchase Details
Closed on
Sep 12, 2019
Sold by
Sims Barbara Joshua
Bought by
Winston Rehabiah T and Winston Rehabiah T
Purchase Details
Closed on
Oct 30, 2015
Sold by
Not Provided
Bought by
Sims Barbara Joshua
Purchase Details
Closed on
Dec 4, 2012
Sold by
Citibank Na
Bought by
Holistic Community Coalition
Purchase Details
Closed on
May 4, 2012
Sold by
Hammond Renee Booker
Bought by
Citibank Na
Purchase Details
Closed on
Dec 30, 2005
Sold by
Arizmendez Daisy
Bought by
Hammond Jeffrey B and Hammond Renee Booker
Home Financials for this Owner
Home Financials are based on the most recent Mortgage that was taken out on this home.
Original Mortgage
$119,700
Interest Rate
8.99%
Mortgage Type
Commercial
Create a Home Valuation Report for This Property
The Home Valuation Report is an in-depth analysis detailing your home's value as well as a comparison with similar homes in the area
Home Values in the Area
Average Home Value in this Area
Purchase History
| Date | Buyer | Sale Price | Title Company |
|---|---|---|---|
| Winston Ashanti | -- | None Listed On Document | |
| Winston Ashanti | -- | None Listed On Document | |
| Winston Rehabiah T | $4,000 | None Available | |
| Sims Barbara Joshua | $300 | None Available | |
| Holistic Community Coalition | -- | Meridian Title Corp | |
| Citibank Na | $24,000 | None Available | |
| Hammond Jeffrey B | -- | Chicago Title Insurance Comp |
Source: Public Records
Mortgage History
| Date | Status | Borrower | Loan Amount |
|---|---|---|---|
| Previous Owner | Hammond Jeffrey B | $119,700 |
Source: Public Records
Tax History Compared to Growth
Tax History
| Year | Tax Paid | Tax Assessment Tax Assessment Total Assessment is a certain percentage of the fair market value that is determined by local assessors to be the total taxable value of land and additions on the property. | Land | Improvement |
|---|---|---|---|---|
| 2024 | $2,377 | $48,900 | $5,400 | $43,500 |
| 2023 | $1,467 | $49,800 | $5,400 | $44,400 |
| 2022 | $1,467 | $48,900 | $5,400 | $43,500 |
| 2021 | $1,215 | $40,500 | $5,400 | $35,100 |
| 2020 | $1,215 | $40,500 | $5,400 | $35,100 |
| 2019 | $2,626 | $40,500 | $5,400 | $35,100 |
| 2018 | $2,286 | $41,700 | $5,400 | $36,300 |
| 2017 | $1,603 | $41,300 | $5,400 | $35,900 |
| 2016 | $2,225 | $43,000 | $5,400 | $37,600 |
| 2014 | $1,765 | $69,100 | $5,400 | $63,700 |
| 2013 | $1,740 | $68,200 | $5,400 | $62,800 |
Source: Public Records
Map
Nearby Homes
- 4002 Grand Blvd
- 3902 Parrish Ave
- 3824 Parrish Ave
- 4401 Elm St
- 4405 Elm St
- 0-Lot4 Elm St
- 0-Lot3 Elm St
- 3803 Parrish Ave
- 4003 Euclid Ave
- 3808 Ivy St
- 3846 Euclid Ave
- 4024 Deodar St
- 4119 Grand Blvd
- 3819 Euclid Ave
- 3732 Deodar St
- 3812 Main St
- 1720 Broadway St
- 3726 Euclid Ave
- 3932 Pulaski St
- 4112 Drummond St
- 3906 Hemlock St
- 3902 Hemlock St
- 3908 Hemlock St
- 3910 Hemlock St
- 3912 Hemlock St
- 3905 Parrish Ave
- 3903 Parrish Ave
- 3907 Parrish Ave
- 3901 Parrish Ave
- 3914 Hemlock St
- 3909 Parrish Ave
- 3911 Parrish Ave
- 3832 Hemlock St
- 3913 Parrish Ave
- 3916 Hemlock St
- 3901 Hemlock St
- 3905 Hemlock St
- 3915 Parrish Ave
- 3907 Hemlock St
- 3845 Parrish Ave