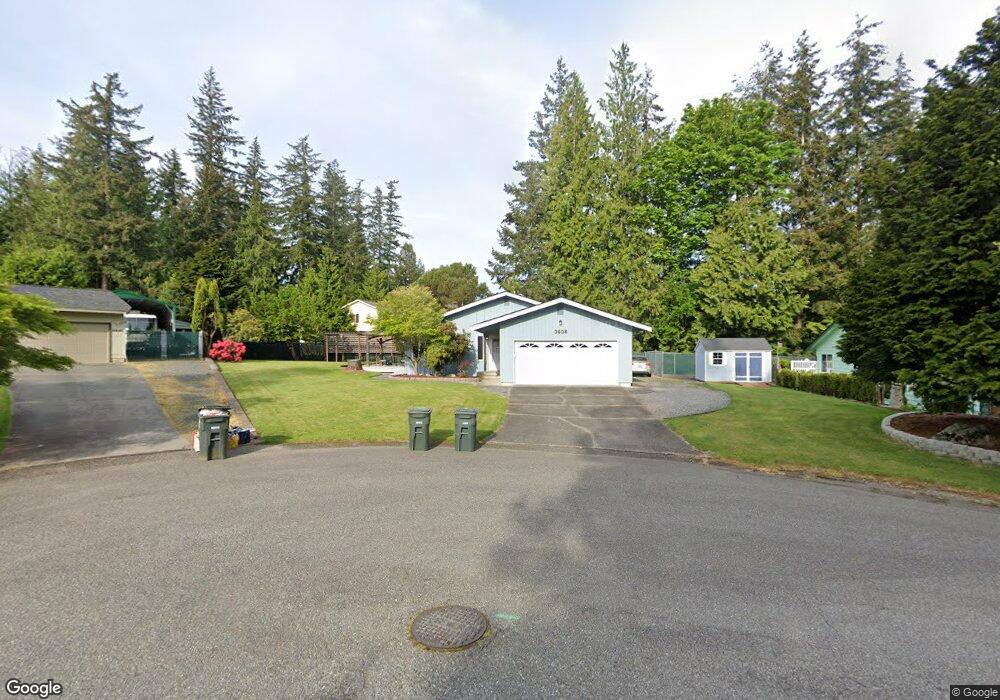
3905 Cedarbrook Ct Bellingham, WA 98229
Estimated Value: $656,272 - $699,000
2
Beds
2
Baths
1,404
Sq Ft
$479/Sq Ft
Est. Value
About This Home
This home is located at 3905 Cedarbrook Ct, Bellingham, WA 98229 and is currently estimated at $671,818, approximately $478 per square foot. 3905 Cedarbrook Ct is a home located in Whatcom County with nearby schools including Carl Cozier Elementary School, Kulshan Middle School, and Sehome High School.
Ownership History
Date
Name
Owned For
Owner Type
Purchase Details
Closed on
Nov 21, 2019
Sold by
Farnsworth Kelly Jo
Bought by
Farnsworth Kelly Jo and Maneval Ken Jay
Current Estimated Value
Purchase Details
Closed on
Jun 14, 2001
Sold by
Hartman Robert A and Hartman Diane C
Bought by
Maneval Ken
Create a Home Valuation Report for This Property
The Home Valuation Report is an in-depth analysis detailing your home's value as well as a comparison with similar homes in the area
Home Values in the Area
Average Home Value in this Area
Purchase History
| Date | Buyer | Sale Price | Title Company |
|---|---|---|---|
| Farnsworth Kelly Jo | -- | None Available | |
| Maneval Ken | -- | Chicago Title Insurance |
Source: Public Records
Tax History
| Year | Tax Paid | Tax Assessment Tax Assessment Total Assessment is a certain percentage of the fair market value that is determined by local assessors to be the total taxable value of land and additions on the property. | Land | Improvement |
|---|---|---|---|---|
| 2025 | $5,389 | $602,954 | $278,528 | $324,426 |
| 2024 | $5,176 | $585,400 | $270,419 | $314,981 |
| 2023 | $5,176 | $600,304 | $277,304 | $323,000 |
| 2022 | $4,326 | $508,743 | $235,008 | $273,735 |
| 2021 | $4,078 | $397,455 | $183,600 | $213,855 |
| 2020 | $3,596 | $368,014 | $170,000 | $198,014 |
| 2019 | $3,315 | $319,832 | $140,600 | $179,232 |
| 2018 | $3,352 | $302,081 | $132,867 | $169,214 |
| 2017 | $2,925 | $260,187 | $114,190 | $145,997 |
| 2016 | $2,599 | $236,776 | $103,835 | $132,941 |
| 2015 | $2,598 | $220,322 | $97,945 | $122,377 |
| 2014 | -- | $213,697 | $95,000 | $118,697 |
| 2013 | -- | $208,874 | $84,075 | $124,799 |
Source: Public Records
Map
Nearby Homes
- 3811 York St
- 4000 Flynn St Unit 33
- 4000 Flynn St Unit 131
- 4000 Flynn St Unit 50
- 4000 Flynn St Unit 107
- 4000 Flynn St Unit 2
- 3820 Ohio St
- 1328 Parkstone Ln
- 1166 Creekwood Ln
- 1323 Roland St
- 1321 Roland St
- 2104 Birch Cir Unit 5C
- 1120 Birch Falls Dr
- 4312 Cordero Dr
- 0 US Highway 27 Hwy N Unit MFRO6376475
- 0 US Highway 27 Hwy N Unit MFRP4936152
- 0 US Highway 27 Hwy N Unit MFRP4935974
- 0 US Highway 27 Hwy N Unit MFRO6335808
- 0 US Highway 27 Hwy N Unit MFRL4957889
- 0 US Highway 27 Hwy N Unit MFRTB8465896
- 3901 Cedarbrook Ct
- 3823 Morning Mist Way
- 3909 Cedarbrook Ct
- 3819 Morning Mist Way
- 3827 Morning Mist Way
- 3900 Cedarbrook Ct
- 3904 Cedarbrook Ct
- 3815 Morning Mist Way
- 3908 Cedarbrook Ct
- 3913 Cedarbrook Ct
- 3901 Lakeway Dr
- 3809 Morning Mist Way
- 3818 York St
- 3811 Lakeway Dr
- 3808 Morning Mist Way
- 3918 Cedarbrook Ct
- 1521 Lowell Ave
- 1529 Lowell Ave
- 3822 York St
- 3917 Cedarbrook Ct
Your Personal Tour Guide
Ask me questions while you tour the home.