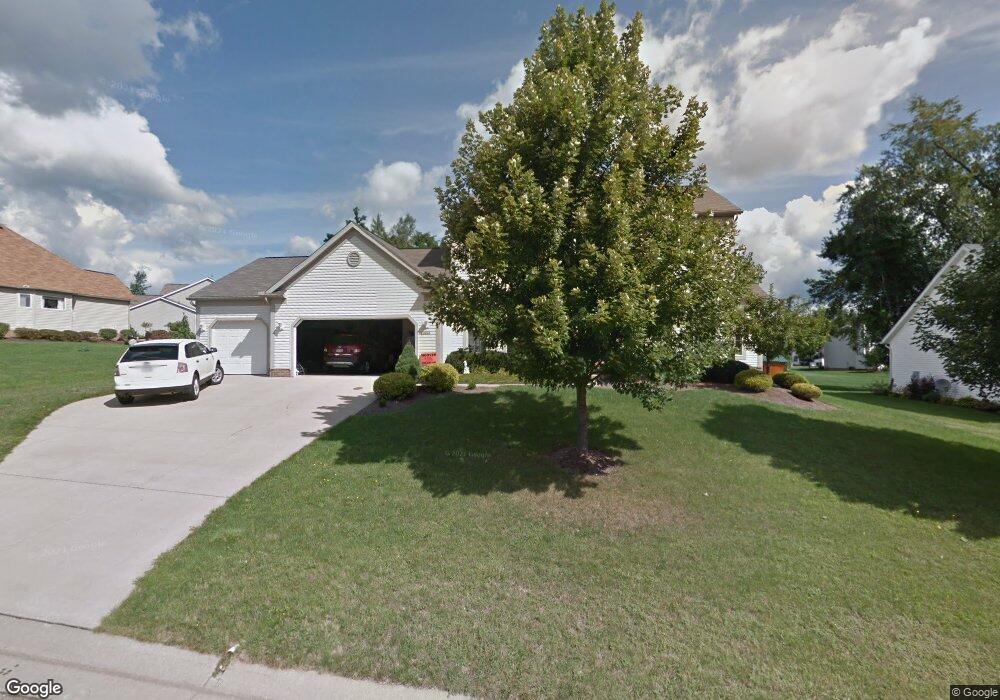
3905 Chawton St NW Uniontown, OH 44685
Estimated Value: $384,000 - $489,000
4
Beds
3
Baths
2,632
Sq Ft
$165/Sq Ft
Est. Value
About This Home
This home is located at 3905 Chawton St NW, Uniontown, OH 44685 and is currently estimated at $435,105, approximately $165 per square foot. 3905 Chawton St NW is a home located in Stark County with nearby schools including North Canton Middle School, Hoover High School, and Mayfair Christian School.
Ownership History
Date
Name
Owned For
Owner Type
Purchase Details
Closed on
Mar 7, 2005
Sold by
Long Gaylord Timothy and Long Lisa M
Bought by
Monter Jeffrey A and Monter Lori M
Current Estimated Value
Home Financials for this Owner
Home Financials are based on the most recent Mortgage that was taken out on this home.
Original Mortgage
$197,600
Outstanding Balance
$100,775
Interest Rate
5.7%
Mortgage Type
Purchase Money Mortgage
Estimated Equity
$334,330
Purchase Details
Closed on
Jan 31, 2001
Sold by
Chatham Development Corp
Bought by
Elson J Hershberger Construction Inc
Home Financials for this Owner
Home Financials are based on the most recent Mortgage that was taken out on this home.
Original Mortgage
$152,320
Interest Rate
6.91%
Mortgage Type
Purchase Money Mortgage
Create a Home Valuation Report for This Property
The Home Valuation Report is an in-depth analysis detailing your home's value as well as a comparison with similar homes in the area
Home Values in the Area
Average Home Value in this Area
Purchase History
| Date | Buyer | Sale Price | Title Company |
|---|---|---|---|
| Monter Jeffrey A | $247,000 | -- | |
| Elson J Hershberger Construction Inc | $43,900 | -- |
Source: Public Records
Mortgage History
| Date | Status | Borrower | Loan Amount |
|---|---|---|---|
| Open | Monter Jeffrey A | $197,600 | |
| Closed | Elson J Hershberger Construction Inc | $152,320 | |
| Closed | Monter Jeffrey A | $37,050 |
Source: Public Records
Tax History Compared to Growth
Tax History
| Year | Tax Paid | Tax Assessment Tax Assessment Total Assessment is a certain percentage of the fair market value that is determined by local assessors to be the total taxable value of land and additions on the property. | Land | Improvement |
|---|---|---|---|---|
| 2025 | -- | $136,050 | $22,330 | $113,720 |
| 2024 | -- | $136,050 | $22,330 | $113,720 |
| 2023 | $5,753 | $107,870 | $18,900 | $88,970 |
| 2022 | $5,519 | $107,870 | $18,900 | $88,970 |
| 2021 | $5,678 | $107,870 | $18,900 | $88,970 |
| 2020 | $5,371 | $93,180 | $16,280 | $76,900 |
| 2019 | $5,030 | $93,180 | $16,280 | $76,900 |
| 2018 | $5,210 | $93,180 | $16,280 | $76,900 |
| 2017 | $4,560 | $85,820 | $17,500 | $68,320 |
| 2016 | $4,577 | $85,820 | $17,500 | $68,320 |
| 2015 | $4,482 | $83,690 | $17,500 | $66,190 |
| 2014 | $125 | $72,840 | $15,260 | $57,580 |
| 2013 | $2,122 | $74,900 | $15,260 | $59,640 |
Source: Public Records
Map
Nearby Homes
- 3851 Cromford Cir NW
- 11065 Dunsby Ave NW
- 11056 Peach Glen Ave NW
- 3863 Heckman St NW
- 3475 Heckman St NW
- 11316 Cleveland Ave NW
- 0 Heckman St NW Unit 5154708
- 10380 Sudbury Cir NW
- 10531 Newbury Ave NW
- 4943 Mayfair Rd
- 3048 Wright Rd NW
- 4786 Mayfair Rd
- 3026 Wright Rd NW
- Sarasota Plan at Spring Hill - Spring Hill Villas
- Chester Plan at Spring Hill - Spring Hill Villas
- Kenai Plan at Spring Hill - Spring Hill Villas
- Holston Plan at Spring Hill - Spring Hill Villas
- Bradbern Plan at Spring Hill - Spring Hill Villas
- Northwood Plan at Spring Hill - Spring Hill Villas
- 2845 Byron Dr
- 3887 Chawton St NW
- 3931 Chawton St NW
- 11176 Bancroft Ave NW
- 3915 Cromford Cir NW
- 11115 Dunsby Ave NW
- 11130 Bancroft Ave NW
- 3907 Cromford Cir NW
- 11202 Bancroft Ave NW
- 3906 Cromford Cir NW
- 3851 Chawton St NW
- 11093 Dunsby Ave NW
- 11108 Bancroft Ave NW
- 11191 Bancroft Ave NW
- 3858 Chawton St NW
- 11230 Bancroft Ave NW
- 11157 Bancroft Ave NW
- 11149 Peach Glen Ave NW
- 11139 Bancroft Ave NW
- 3827 Chawton St NW
- 11090 Bancroft Ave NW