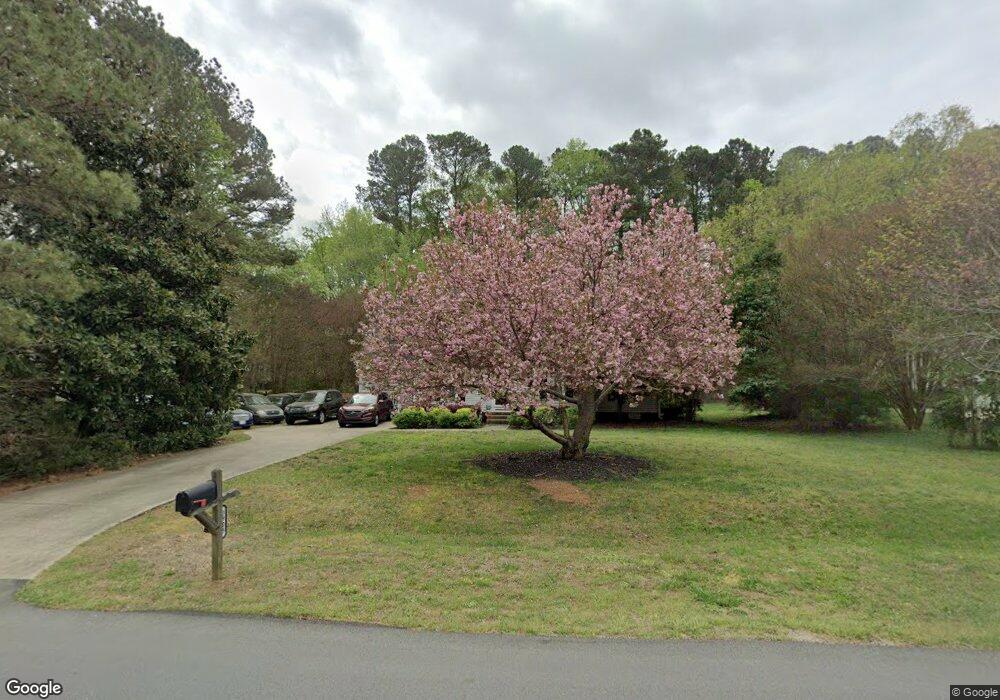
3905 Durnford Dr Apex, NC 27539
Middle Creek NeighborhoodEstimated Value: $414,000 - $453,672
4
Beds
3
Baths
2,000
Sq Ft
$218/Sq Ft
Est. Value
About This Home
This home is located at 3905 Durnford Dr, Apex, NC 27539 and is currently estimated at $435,668, approximately $217 per square foot. 3905 Durnford Dr is a home located in Wake County with nearby schools including West Lake Elementary School, West Lake Middle, and Middle Creek High.
Ownership History
Date
Name
Owned For
Owner Type
Purchase Details
Closed on
Jul 2, 2025
Sold by
Ballard Derek D and Alves Maria A
Bought by
Ballard Derek D and Alves Maria A
Current Estimated Value
Purchase Details
Closed on
Oct 17, 2011
Sold by
Ballard Angela F
Bought by
Ballard Derek D
Home Financials for this Owner
Home Financials are based on the most recent Mortgage that was taken out on this home.
Original Mortgage
$153,000
Interest Rate
4.2%
Mortgage Type
New Conventional
Purchase Details
Closed on
Apr 26, 2000
Sold by
Banc One Financial Services Inc
Bought by
Ballard Derek D and Ballard Angela F
Home Financials for this Owner
Home Financials are based on the most recent Mortgage that was taken out on this home.
Original Mortgage
$114,400
Interest Rate
8.23%
Purchase Details
Closed on
Aug 20, 1999
Sold by
Johnson Wrencis L
Bought by
Banc One Financial Services Inc
Create a Home Valuation Report for This Property
The Home Valuation Report is an in-depth analysis detailing your home's value as well as a comparison with similar homes in the area
Home Values in the Area
Average Home Value in this Area
Purchase History
| Date | Buyer | Sale Price | Title Company |
|---|---|---|---|
| Ballard Derek D | -- | None Listed On Document | |
| Ballard Derek D | -- | None Listed On Document | |
| Ballard Derek D | -- | None Available | |
| Ballard Derek D | $143,000 | -- | |
| Banc One Financial Services Inc | $140,000 | -- |
Source: Public Records
Mortgage History
| Date | Status | Borrower | Loan Amount |
|---|---|---|---|
| Previous Owner | Ballard Derek D | $153,000 | |
| Previous Owner | Ballard Derek D | $114,400 | |
| Closed | Ballard Derek D | $21,450 |
Source: Public Records
Tax History Compared to Growth
Tax History
| Year | Tax Paid | Tax Assessment Tax Assessment Total Assessment is a certain percentage of the fair market value that is determined by local assessors to be the total taxable value of land and additions on the property. | Land | Improvement |
|---|---|---|---|---|
| 2025 | $2,302 | $356,758 | $150,000 | $206,758 |
| 2024 | $2,235 | $356,758 | $150,000 | $206,758 |
| 2023 | $1,892 | $240,039 | $77,000 | $163,039 |
| 2022 | $1,754 | $240,039 | $77,000 | $163,039 |
| 2021 | $1,707 | $240,039 | $77,000 | $163,039 |
| 2020 | $1,679 | $240,039 | $77,000 | $163,039 |
| 2019 | $1,646 | $199,086 | $73,000 | $126,086 |
| 2018 | $1,514 | $199,086 | $73,000 | $126,086 |
| 2017 | $1,436 | $199,086 | $73,000 | $126,086 |
| 2016 | $1,407 | $199,086 | $73,000 | $126,086 |
| 2015 | $1,287 | $182,452 | $62,000 | $120,452 |
| 2014 | $1,221 | $182,452 | $62,000 | $120,452 |
Source: Public Records
Map
Nearby Homes
- 8405 Bells Lake Rd
- 8224 Bells Lake Rd
- 8220 Bells Lake Rd
- 8201 Rhodes Rd
- 3101 Sawyers Mill Dr
- 804 Blue Thorn Dr
- 5045 Homeplace Dr
- 8844 Forester Ln
- 3408 Sawyers Mill Dr
- 212 Sea Biscuit Ln Unit 25
- 4317 Glen Arbor Dr
- 333 Calvander Ln
- 120 Corapeake Way
- 124 Corapeake Way
- 128 Corapeake Way
- 104 Corapeake Way
- 4301 New Brighton Dr
- 8401 Piney Branch Dr
- 8008 Deer Meadow Dr
- 6025 Larboard Dr
- 3909 Durnford Dr
- 3901 Durnford Dr
- 3904 Durnford Dr
- 3913 Durnford Dr
- 8412 Wanstraw Way
- 3908 Durnford Dr
- 8501 Wanstraw Way
- 8505 Wanstraw Way
- 8417 Wanstraw Way
- 3917 Durnford Dr
- 3912 Durnford Dr
- 8413 Wanstraw Way
- 8408 Wanstraw Way
- 8409 Wanstraw Way
- 3921 Durnford Dr
- 8517 Wanstraw Way
- 8404 Wanstraw Way
- 8509 Wanstraw Way
- 8405 Wanstraw Way
- 3212 Optimist Farm Rd